


WallsHeaven makes decorative wall murals in high quality printing

287,586 Stock Vector Economy Wall Murals - Canvas Prints - Stickers

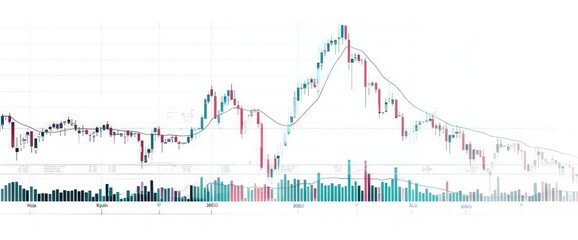
Vector illustration of a candlestick chart, ideal for representing stock market analysis, financial trends, and trading data.
bank building vector icon Silhouette set, Bank Government Courthouse Architecture simple land mark. museum, university icon, academic institute university stock vector,
Clean stock chart with an upward slope, signaling a consistent increase in stock values over time.
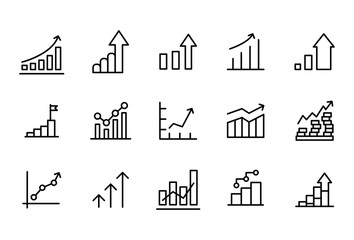
Business graphs and charts icons. Business infographics icons. Statistic and data, charts diagrams, money, down or up arrow, economy reduction. Financial chart. Vector illustration.
Rows of computer screens in a bustling trading floor with financial data flashing.
Business candle stick graph chart of stock market investment trading on blue background. Bullish point, up trend of graph. Economy vector design
Forex and stock exchange chart vector illustration. Japanese candle stick graph of stock market trading. Finance and forex trade background
Business candle stick graph chart of stock market investment trading on white background design.
Market share icon logo set vector
economic crisis stock chart falling down business global money bankruptcy concept
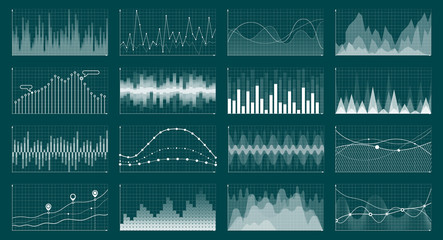
Financial data graph chart, vector illustration. Trend lines, columns, market economy information background. Chart analytics economic concept.
Economic graph with diagrams on the stock market Abstract vector white background for business
Searching Defensive stock protection in economic crisis and recession or stock market down, Worldwide business crisis trend as a financial stock economic fall or falling downtrend.
Growth arrow and development. Digital financial chart indicators, stock market chart, business and exchange financial growth graph. Stock market trading graph and financial investment.
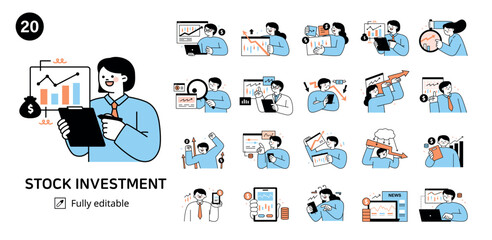
Characters investing money in stock market. People analyzing financial graphs, charts and diagrams and other data. Stock trading concept. Flat cartoon vector illustration and icons set.
A glowing graph showing economic growth and stock market trends against a dark blue background. This modern design uses abstract shapes and looks futuristic.low poly wireframe.
business vector illustration design Stock market charts or Forex trading charts for business and finance ideas.
Neon stock market graph, red and pink lines going up on a black background-gigapixel-art-scale-4_00x
stock market icon set containing stocks
A financial report with charts and graphs. vector art illustration
dollar coin money with growth arrow symbol, illustration of economic and financial growth icon vector
gray background with stock market chart, line graph, and connecting dots in gray color on a white backdrop. Financial data visualization with analytical element
Abstract financial chart with up trend line graph
blue digital technology network chart background
White background featuring a financial chart with a consistent upward rise in stock prices.
Business candle stick graph chart of stock market investment trading on blue background. Bullish point, Trend of graph. Eps10 Vector illustration.
Close-up of 3D navy blocks creating a stock market uptrend, highlighting financial success on a teal background.
Stock market trading graph in graphic concept vector design.
3d icon realistic growth stock chart coins investing new concept vector design
3D graph up with alert notice icon for finance statistic, sell and buy report. analyzing investment money cash and exchange with finance. 3d trading stock report icon vector render illustration
3d vector icon of green arrow with graph going up, on white background next to piece of paper with blank space for text stock photo contest winner, business plan icons,
Forex trading stock market background
abstract financial chart sideways line graph and candlestick on white background
AI chip and stock market candlesticks in low poly wireframe tech blue. Stock market and artificial intelligence background. Forex and trade and AI microchip or processor bg. Vector Illustration.
Business Cycle icon set. Population, Production, Welfare, Recession, Real Income, Economic, Economic Growth, Pricing. Duotone color solid icons
Abstract Financial Chart With Uptrend Line Graph
3D set realistic golden coins and coins with star with different angles. Symbol of gold and wealth. Stock vector illustration on isolated background.
Graph line icons. Vector illustration include icon - data analysis, diagram, stat, histogram, economy outline pictogram for infographic statistic presentation. 64x64 Pixel Perfect, Editable Stroke
Bse Building bombay stock exchange Indian share market graph up bullish vector poster
Bombay stock exchange, Mumbai, India
green arrow business graph pointing up represent profit
economic recession in 2023  Graphs and slumping stock markets show the global economic crisis in 2023.  The effects of inflation, war, epidemics. EPS10 vector.
economic recession in 2023 Graphs and slumping stock markets show the global economic crisis in 2023. The effects of inflation, war, epidemics. EPS10 vector.
Finance and Money web icons in line style. Money, bank, profit, finance capital, payment, auction, exchance, wallet, deposit infographic. Icon collection. Vector illustration.
A financial report with charts and graphs. vector art illustration
Sky blue sharp arrow moving up a financial graph, dark background, high detail,
Business candle stick graph chart of stock market investment trading on blue background. Bullish point, Trend of graph. Eps10 Vector illustration.
Economic downturn and Inflation. slowing or worse as inflation rises. stock market slump. .World economy recession. Businessman tries to pull the graph up with a rope.
Crisis of economy and bankruptcy icons set. Debt, loss, down, inflation. Vector stock
Finance concept, Business graph,Business candle stick graph chart [illustration]
Business failure, company bankruptcy, stock market crash and loss trading graph. The concept of economic recession and crisis. Fall of world trade. Negative investment indicator down turn infographics
Stock Market Trading Chart On Dark Blue Background. Business Wallpaper. Finance Banner. Graph. Vector Illustration
Long business growth curved arrow. Financial goal background template. Investment economy value concept.
Editable Icons Set for ESOP Business | Perfect for Financial Reports, Corporate Presentations, and Business Growth
Analysis finance grow graph and market  investment. Financial  business plan,earnings,sale and strategy. Stock market chart, exchange financial growth diagram.
Analysis finance grow graph and market investment. Financial business plan,earnings,sale and strategy. Stock market chart, exchange financial growth diagram.
Business document data analysis with magnifying glass and calculator, Paper sheet with document Folder, Auditing financial documents, flat vector illustration.
Flat icon of Growth graph vector. Business chart. Financial rise up. Increase profit. Economic graphic growth arrow rising. Chart i icon in black and white background.
Set of posters in halftone style. Trendy collage with hand holding coins and stock market charts and graphs. Business and Finance. Realistic vector illustration collection isolated on white background
Growth logo design template. Simple tree symbol and light bulb logo vector.
stock market. People who trade stocks. Market analysis and graph data.
Increase and Decrease line icons set . vector illustration . white background. editable stroke . Graph, Diagram, business finance, growth, maximize, minimize, up down, chart, profit, success, market,
Business statistic concept illustration vector
Simple set of growth modern thin line icons.
Business graphs and charts icons. Business infographics icons. Statistic and data, charts diagrams, money, down or up arrow, economy reduction. Financial chart. Vector illustration.
Minimalistic line graph on light lavender background, upward trend, market growth illustration, clean simplicity
Business candle stick graph chart of stock market investment trading on blue background. Bullish point, up trend of graph. Economy vector design
Line icons about increase and decrease. Contains such icons as stock market, profit, launch and more. Editable vector stroke. 64x64 pixel perfect
Abstract neon blue and pink stock market chart graphic.
Growth bar chart with columns, down and up chart. Financial stock market, data analysis and business concept. 3d vector icon. Cartoon minimal style.
Elegant line graph on mint green background, rising steadily, market growth signal, minimalist style
Business candle stick graph chart of stock market investment trading on blue background. Bullish point, up trend of graph. Business investment concept. Economy vector design
Red Arrow Showing Downward Trend In Grid Graph.
Stock market bull market trading Up trend of graph green background rising price Generative AI.
Economic crisis and money loss icons, downturn and bankruptcy symbols, line vector. World financial crisis and global economy recession icons of business bankruptcy, finance downturn and unemployment
Income glyph solid icons collection. Containing passive income, commission, salary, dividend, payment. Minimal icon and symbol series vector illustration
A magnified snapshot of a stock graph, highlighting the delicate nuances of market trends.
Income icon set. Containing money, tax, earnings, payment, accounting, paycheck, work, pension and wages icons. Solid icon collection. Vector illustration.
Business growth graph success chart with arrow, profit growing symbol, progress bar symbol, growing graph icons. Vector illustration.
set of 30 line web icons Investment, Profits, bear, bull, stock exchange, profits, trading, growth, collection. Editable stroke.
Employees analyze stock market and financial charts concept flat illustration
Successful financial boost and up arrow with candlesticks. Rising stock market economy concept. Futuristic finance growth bar chart.
 3d Business upgoing pie chart vector arts illustration
3d Business upgoing pie chart vector arts illustration
Vector illustration of data analysis, statistics, research. Monitoring investment and finance report, person analyzing business growth, finance investment planning. Thin line icons design.
economy stock graph vector background
Mega set flat design concept payment, stock market, mobile commerce, electronic receipt with people character situations. Bundle of different scenes. Collection vector illustrations.
Business candle stick graph chart of stock market investment trading on blue background. Bullish point, up trend of graph. Economy vector design
Financial report illustration set. Characters analyzing charts, balance sheet, income statement and other business data. Financial management concept. Vector illustration.
Business candle stick graph chart of stock market investment trading on white background design. Bullish point, Trend of graph. Vector illustration
Business growth currency stock and investment economy for the year 2024.
Abstract glowing big data forex candlestick chart on blurry city backdrop. Trade, technology, investment and analysis concept
Stock market graph background. Concept of business investment. Stock future trading.Trend of graph.Economy vector design
Investment Funds glyph icon set, contain exchange, allocation, bonds, commodity, inflation, equities and more. vector EPS 10. use for UI, UX, app and web development. for financial and business theme.
green stock market graph abstract background isolated vector style
Currency grow chart. Stock graph diagram, finance and economic market analysis graphs. Analysis economics graphs vector concept
business value icon set collection. Profit, Growth, Efficiency, Innovation, Customer Satisfaction, Quality, Reputation, Reliability, Sustainability, Brand Identity
Applying advanced data visualization methods to analyze stock market volatility and risk factors effectively.
Line icons about increase and decrease. Contains such icons as stock market, profit, launch and more. Editable vector stroke. 512x512 Pixel Perfect in transparent background.
Investment icon set. Containing investor, mutual fund, asset, risk management, economy, financial gain, interest and stock icons. Solid icon collection.


Why Wallsheaven is special?

30 Days on Returns

You can return or replace any product within 30 days without reason.

Free Express Delivery

Delivery is free for all of our products, wherever you are.

Eco Water-Based Inks

Our prints are odorless, ecological, and safe for children with vivid colors from natural dyes.

Simple Installation

Installing WallsHeaven's wallpaper mural is as easy as making paper airplane.

Artist Support

By choosing our photos, you will support the artists from all over the world.