



WallsHeaven makes decorative wall murals in high quality printing

1,007,042 Stock+financial+datum Wall Murals - Canvas Prints - Stickers

Stock market graph .Business candle stick graph chart of stock market investment trading on dark background design. Trend of graph, Bullish point. Vector illustration
Silhouette of person analyzing financial data on laptop during sunset
financial chart
financial chart
Man analyzing financial data on a digital tablet
Calculator with Business Graphs finance document.
Close up financial chart with uptrend line graph in stock market on defocused blue color bokeh background
Creative image of growing coin stacks and candlestick forex chart on blurry background. Trade, money and financial growth concept. Double exposure.
Businessman or trader is showing a growing virtual hologram stock. , planning and strategy, Stock market, Business growth, progress or success concept. , invest in trading.
Stock market digital graph chart on LED display concept. A large display of daily stock market price and quotation. Indicator financial forex trade education background.
Businessman analyst working with digital finance business data graph showing technology of investment strategy for perceptive financial business decision. Digital economic analysis technology concept.
Double exposure Economics growth diagrams on blurred background. Business and investment concept
Coins place on stock chart or cryptocurrency chart bar uptrend from red to green and profitable for trader
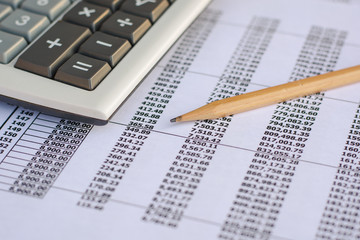
Summary report and financial analyzing concept, Pen and calculator with thailand coin on paperwork.
African American businesswoman analyzing financial data on computer dashboard.
Stock market digital graph chart on LED display concept. A large display of daily stock market price and quotation. Indicator financial with buildings background
Business concept : Financial accounting stock market graphs analysis.
Photo blue growth graph business chart data diagram on success financial presentation background
A businessman checking stock market data on a tablet against a nighttime background.
A businessman reviewing a financial statement with a magnifying glass, focusing on key details like assets, liabilities, and equity.
magnifying glass on data, abstract metrics and indicators charting and upward movement, background space, computing and analytics concept
Candlestick chart in financial stock market on digital number background. Forex trading graphic design and Stock market trading trend as concept.
Focused stock trader analyzing financial data on monitors with graphs.
 City lights and stock market data a blend of urban life and financial trends
City lights and stock market data a blend of urban life and financial trends
Businessman analysis diagram. Business graph background. financial graph, Stock exchange chart
Double exposure of coin stack with stock market screen chart board and candle stick for financial business and investor analysis concept.
bussiness image
bussiness image
Analyzing Financial Data on Digital Display. Close-up of a hand pointing at financial graphs on a high-tech digital screen, indicative of market analysis and investment strategies.
Report graph and chart of investment with finance on tablet computer on desk, datum of stock and growth, planning and statistic with economic, no people, digital marketing, business concept.
3d graph
3d graph
Modern business workspace with financial charts.
Double exposure Economics growth diagrams on blurred background. Business and investment concept
Stock market exchange loss trading graph analysis investment indicator business graph charts of financial board display candlestick crisis stock crash red price chart fall money -
Businessman using a tablet in hand with analyzing financial statistics displayed on the tablet screen
close-up shot of a diverse group of African financial professionals analyzing KPI data and profits on a computer dashboard in a modern office setting.
Businessman using a laptop Show a positive digital technology graph chart.
Stock market digital graph chart on LED display concept. A large display of daily stock market price and quotation. Indicator financial forex trade education background.
Hand drawing  chart, graph stock of growth
Hand drawing chart, graph stock of growth
Economic graph with diagrams on the stock market, for business and financial concept
Stock market trading graph and candlestick chart on screen for businese financial investment concept. Economy trends background. Abstract finance and invest background.
Professional Financial Data Analysts Working in a Modern Monitoring Office with Live Analytics Feed on a Big Digital Screen. Monitoring Room with Finance Specialists Sit in Front of Computers.
financial chart
financial chart
Stock market chart
Stock market chart
Stock exchange board, market index graphs and charts, vector screen background. Stock exchange board display with financial data numbers, stock trade rates of bank investments growth and decrease
graph with red arrowbusiness, graph, chart, arrow, growth, success, finance, diagram, bar, market, 3d, progress, up, illustration, red, money, profit, grow, financial, economy, graphic, increase, data
Businessman examines financial data on laptop, stock market trends, investment concept
graph isolated on white
Digital screen showcasing electronic stock market charts with intricate patterns and data trends, highlighting the complexity and precision of financial analysis tools.
Graph
Graph
economy growth and finance concept. stock market graph with bar chart on blue background
Forex Chart hologram on table with computer background. Multi exposure. Concept of financial markets.
Business finance growth graph chart analysing diagram trading and forex exchange concept double exposure mixed media background website header.
An exchange chart of money on investment and a graph of currency trading profit analysis for digital economic technology, or a marketing strategy.
Foreign exchange, commonly known as Forex or FX, is the exchange of one currency for another at an agreed exchange price on the over-the-counter(OTC) market. Forex is the world’s most traded market.
Abstract Accounting Background
raise arrow chart digital transformation abstract technology background. Big data and business growth currency stock and investment economy
A financial chart showing stock market trends with upward and downward lines in red and green, set on a sleek white background, Realism, High-definition, Data Visualization
Abstract blue growing financial graph chart background. Vector dotted lines tech design
stock market, economic graph with diagrams, business and financial concepts and reports, abstract technology communication concept vector background
Spreadsheet and Pen
Spreadsheet and Pen
Economic growth concept with charts
The group of business investor trading or stock brokers having a planning and analyzing with display screen and pointing on the data presented and deal on a stock exchange.
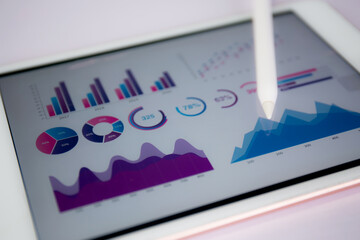
Digital tablet computer showing stock market data
Businessman touching data analytics process system with KPI financial charts, dashboard of stock and marketing on virtual interface. With Netherlands flag in background.
Abstract glowing blue business graph on blurry background. Financial growth, market and stock concept. 3D Rendering.
Ai Robot hand touching forex charts and diagrams stock market display on board. Investment and trading on stock market with Artificial Intelligence concept.
graph with arrow
graph with arrow
chart
chart
Business analyzing financial statistics displayed on the screen
A man in a suit is looking at a computer screen with red lines on it
digital composite of business statistics and graph with computer on the background
Finance and investment data search concept. Businessman hand holding magnifier and zooming at candlesticks bar chart of stock market data. Stock market analyzing, stock information search.
financial stock market graph on laptop screen 3d illustration
Market analysis graph showcases a prominent green arrow amidst rising figures, reflecting a surge in stock prices and financial growth
Businessman analysis stock exchange market with Money coins and financial graph. Business Growth concept
financial chart
financial chart
Futuristic green raise arrow chart digital transformation abstract technology background. Big data and business growth currency stock and investment indicator of set trade economy. Vector illustration
Financial chart with a growth arrows. Business, Investment
stock market 2021, economic graph with diagrams, business and financial concepts and reports, abstract technology communication concept vector background
Modern outline style analysis icons collection.
person hand analyzing financial data on digital tablet
Office accessories for business management.
Coins on a graph, economy, business.
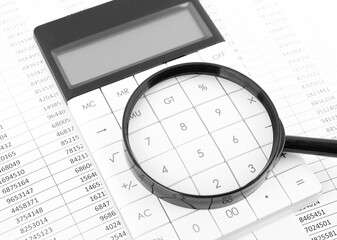
Magnifying glass with calculator on financial and accounting data.
Presenting average sales report
Financial data graph chart, vector illustration. Abstract background with graph chart finance. Business concept.
Businessman on the laptop the stock market concept design Investments and deposits interest
Financial papers on the table
Personal financial planning concept. Businessman workplace with papers for financial planning. Business people discussing the charts and graphs showing the results of successful financial planning.
Businesswoman speaks phone and stock market financial chart hologram. Double exposure. Online trading bonds, shares and currencies concept.
coin and paper with business concept
Double exposure of financial chart on Moscow city downtown background. Concept of stock market analysis
3D illustration of fnancial business chart with diagrams and stock numbers showing profits and losses over time dynamically
finanza, monete, dito, economia, affari, guadagni,
KPI Dashboard on virtual screen. Businessman analysing finance data graph on stock market. Financial management technology.	
Dashboard a wallet Account digital.
KPI Dashboard on virtual screen. Businessman analysing finance data graph on stock market. Financial management technology. Dashboard a wallet Account digital.
financial chart
financial chart
Business financial graph report background
3d blue stock chart
3d blue stock chart


Why Wallsheaven is special?

30 Days on Returns

You can return or replace any product within 30 days without reason.

Free Express Delivery

Delivery is free for all of our products, wherever you are.

Eco Water-Based Inks

Our prints are odorless, ecological, and safe for children with vivid colors from natural dyes.

Simple Installation

Installing WallsHeaven's wallpaper mural is as easy as making paper airplane.

Artist Support

By choosing our photos, you will support the artists from all over the world.