
WallsHeaven makes decorative wall murals in high quality printing

374,799 Stock+diagram+report Wall Murals - Canvas Prints - Stickers

Concept of financial crisis, a gradual decline in coin pile with a blurry graph of investment stocks behind - 3d render.
Abstract polygonal light design of tablet with stock market investment chart
business chart and light bulb
Modern business workplace
Two lines chart at comparision concept. Data analysis graph. Financial chart, analyzing report
Business graph and rows of coins growth for finance and business concept, stock market and currency exchange, Abstract and symbol on colorful background.
Monitoring business
Monitoring business
Financial reports
Financial reports
Businessman plan graph growth increase of chart positive indicators in his business
Businesswoman analyzing company financial balance sheet working with digital virtual graphics Businessman calculating financial data for long term investment growth goals
Business candle stick graph chart of stock market investment trading on blue background.Bullish point, Trend of graph. Eps10 Vector illustration.
Profitable algorithmic trading concept with digital growing forex chart candlestick and circuit at laptop background
business investment trading stock on blue dark background. chart increase digital technology. financial data strategy. market chart profit money. vector illustration hi-tech. candlestick forex growth.
Stock financial index of successful investment on property development business and construction indistry with chart and graph  for presentation and report background.
Stock financial index of successful investment on property development business and construction indistry with chart and graph for presentation and report background.
Composing with business building and stock chart (red bear chart) background
Manipulation vector concept. Businessman controlling financial graph to grow
Smartphone on laptop keyboard with business graph reflection
Man with Chart
Man with Chart
Business graph with arrow showing profits and gains on the stock exchange
Alarm clock on business charts on the table
stock market, economic graph with diagrams, business and financial concepts and reports, abstract blue technology communication concept background
Work in stock exchange
Financial analysis
Financial analysis
The report summarizes the results of business operations, pen, calculator on desk of investor.
Businessman analyzing business marketing report with financial graph
Financial and business chart and graphs
Businessman with paper document standing near rising stock market lines
Businessman plan graph growth and increase of chart positive indicators
Businessman hand holding a magnifying glass on black background. Business and financial concept.
3d illustration inflation and deflation graph with oil tank
Background with currency bars and candles. Financial diagram with candlestick chart used in market analysis for variation report of share price
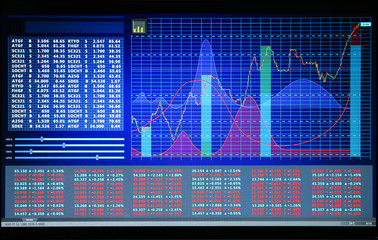
Monitor with stock data, closeup. Financial trading concept
On financial reports with diagrams, figures of businessmen and wooden cubes with the inscription - EPS
Stock index growth shown by graph and chart in resort hotel travel business background.
Businessman and Hong Kong city view with red bear chart on background. double exposure
Business growth
Business growth
Business diagram on financial report with coins
businessman investment consultant analyzing company financial report balance sheet statement working with digital graphs. Concept picture for stock market, cash, fund,and business economy flow.
Hand of young business man looking document data graph and chart paper, marketing and investment, report of statistics profit for financial, economic and growth of finance, management and planning.
stock market analysis and graph chart. 3d illustration
Business Growth Bar Graph Curve. 3D Render Illustration
Bar graph line icons set. Graph, Line, Bar, Chart, Diagram, Report, Statistics. Business graphs and charts icons. Business infographics. Statistic data, charts, vector
Hand drawing chart, graph stock of growth
Professional report accounting design concept. statistic charts for planning and accounting, analysis, audit, management, marketing, research vector illustration.
99 percent,circle percentage diagram vector illustration,infographic chart.
Pricing chart/An illustration of the display of a quote pricing chart. Analysis of financial statistics on a dark background with growing financial charts. Stock analysis.
Credit cards on stock chart
Businessman plan graph growth and increase of chart positive indicators in his business
Businessman hand using mobile phone with stock market report interface.
Stock trading, investment, candle stock market chart diagram website header banner city view skyline.
Asian businesswoman sitting on working space and looking the Stock market exchange information and Trading graph
Businessman touching virtual screen Analyzing financial and investment data, planning strategies to increase sales profits, long-term business plans.
Workplace with tablet and stock charts. Accountant work table
Businessman holding virtual stock market chart and graph for analysis , Value investment and trading concept.
Multi exposure of abstract financial diagram on computer background, banking and accounting concept
continuous line of businessman drawing graph growing. Design Illustration of the concept of business success through growth graph. Investor. Profit Stock Market. Business concept.
Business graph on blue background design. Economic diagram. Vector illustration
Business virtual screen graph chart digital technology and trader online trading investment in stock market for cryptocurrency money and bitcoins using data in blockchain. 3D illustration.
Business candle stick graph chart of stock market investment trading on blue background. Bullish point, up trend of graph. Economy vector design
Business graph..
Business graph..
Business graph and chart
Stock exchange market graph. Finance, exconomic, business concept.
stock chart rise and fall in prices
Stock exchange chart graph. Finance business background. Abstract stock market diagram candle bars trade.
Red going down stock icon on transparent background. Financial market crash graph png. Graph chart downtrend symbol. chart going down sign.
Stock trader business man looking at graph stock market on screen analyzing invest strategy, financial risks
Worldcom – Finance/Economy. Folder on desk with label beside diagrams. Business/statistics. 3d rendering
Businessman plan graph growth and increase of chart positive indicators
Drawing business chart showing financial crisis at stock market
Business graph analysis report. Accounting
Financial data graph chart report statistic marketing research development planning management strategy analysis accounting. Financial business technology hologram concept. Comeliness
Business auditing, analysis, accounting, calculation, analytics. Documents with charts and graphs for review. Documentation, magnifying glass, calculator. Financial report. Isometric 3d
Accounting
Accounting
money with computer on table and graph chart
Charts on a white background with glasses.
Stock market finance account report
Economic graph with diagrams on the stock market. Abstract vector background for business and financial concepts and reports.
Fund managers team consultation and discuss about analysis Investment stock market by document paper.
Finance Stock market with abstract light trials background. Index graph chart
Businessman working on business analytics dashboard with KPI, charts, metrics to analyze data and create insight reports for executives and strategical decisions, Operations, performance management
Business goal and target success concept, businessman holding goal of becoming a leader investing in assets Business and finance, arrow up, global economic trend analysis, Financial graph analysis.
Business planning  concept, calculator on financial reports, collage with clock
Business planning concept, calculator on financial reports, collage with clock
Digital Marketing Strategy Dashboard on the screen.
stock growth
stock growth
Draughtsmanship tools on the white background.
Chart increasing vector flat icon. Isolated stock market graph bar emoji illustration
Business stock market, trading, info graphic with animated graphs, charts and data numbers insight analysis to be shown on monitor display screen for business meeting mock up theme
Economic growth concept with charts
Medical marketing and Health care business analysis report
data graphics analysis
business chart report
Doodle drawing growth bar chart
business chart with world..
Graph of the incidence. Stock Market Chart on Blue Background. Multi-colored lines on the chart. Coronavirus, Pandemic
customer retention business graph
Financial charts on the table with laptop .
Economic graph with diagrams on the stock market. Abstract vector background for business and financial concepts and reports.


Why Wallsheaven is special?

30 Days on Returns

You can return or replace any product within 30 days without reason.

Free Express Delivery

Delivery is free for all of our products, wherever you are.

Eco Water-Based Inks

Our prints are odorless, ecological, and safe for children with vivid colors from natural dyes.

Simple Installation

Installing WallsHeaven's wallpaper mural is as easy as making paper airplane.

Artist Support

By choosing our photos, you will support the artists from all over the world.