
WallsHeaven makes decorative wall murals in high quality printing

584,453 Signs+chart+datum Wall Murals - Canvas Prints - Stickers

Set of 3D isometric cylinder percentage bar chart from 0 to 100 ready-to-use for web design, user interface (UI) or infographic - red, yellow, green, blue, purple and gray
 financial symbols coming from hand
financial symbols coming from hand
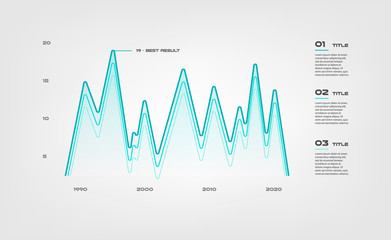
Flat vector Diagram for Bimodal Curves EPS10
Japanese candlestick black and white chart showing downtrend market on black background with indicators: Volume, Moving average.
Investment, Accounting and Bitcoin graph icons simple set. Trade infochart, Shopping and Currency signs. Economic statistics, Supply and demand. Finance set. Line investment icon. Editable stroke
Financial Diversification Chart With Clock and Dollar Sign, Financial diversification plan composition with income symbols, profit accounting, Simple and minimalist flat Vector Illustration
Candles chart diagram graph stock trading investment business finance concept mixed media double exposure virtual screen.
24 icons Infographics Data analysis on white background,vector
3D infographics and business ladder.
Business circle. timeline infographic icons designed for abstract background template milestone element modern diagram process technology digital marketing data presentation chart Vector
Vector infographic circle. Cycle diagram with 7 stages. Round chart that can be used for report, business analytics, data visualization and presentation.
Business concept. graph and charts .

lying composition 3d icon, UI icon, a chart icon, bar chart has a rising arrow on it, bar chart, pie chart, a rising arrow, frosted glass, transparent, white background, transparent technology sense
open book, business concept concept
flat design graph chart and earth globe icon vector illustration
Financial data on a monitor
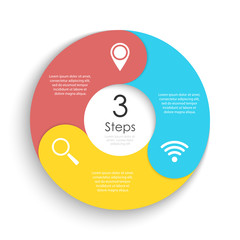
3 steps simple&editable process chart infographics element. EPS 10.
Simple set of growth modern thin line icons.
Vector circle chart infographic template with arrow for cycle diagram, graph, web design. Business concept with 6 steps or options.
Minimal step infographics design vector and icons can be used for workflow layout, diagram, annual report. Vector infographics timeline design template with 4 options, parts, steps or processes.
Trend icon sign design
Business data visualization.
economy situation concept. Financial business statistics with bar graph and candlestick chart show stock market price and currency exchange on green background
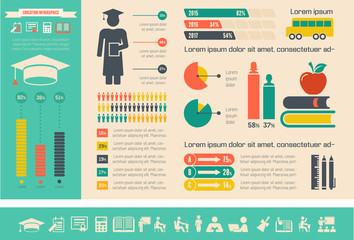
Education Infographics.
Statistics, accounting icons. Charts, presentation and pie chart signs. Analysis, report and business case symbols. Chat, Report and Calendar line signs. Service, Pencil and Locker icons. Vector
wine city logo style line art
80% red pie chart isolated on white background. 3d illustration.
The multi-colored chart on the chalkboard
Sankey icon of 3 types. Isolated vector sign symbol.
wine infographic on vinous background
Success money target finance business growth financial graph profit chart concept on goal strategy 3d background of increase wealth revenue economy development or digital marketing technology stock.
user.interface linear icon set. includes thin line anonymous message, increasing data, blackboard with, mail inbox, bad idea, boxed line stocks, flow chart interface icons for report, presentation,

lying composition 3d icon, UI icon, a chart icon, bar chart has a rising arrow on it, bar chart, pie chart, a rising arrow, frosted glass, transparent, white background, transparent technology sense
Businessman holding diagram cloud
Financial charts and graphs. 3d render ..
Pie Chart Icon
Pie Chart Icon
13 37 50 percent 3d Isometric 3 part pie chart diagram for business presentation. Vector infographics illustration eps.
Modern business chart Infographic with colourful half pie chart 4 part and place for text
Vector circle chart infographic template for cycle diagram, graph, web design. Business concept with 3 steps or options. Abstract background.
Financial graphs and charts and pen on wooden background
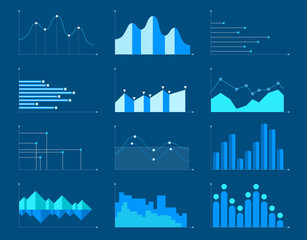
Business charts and graphs infographic elements vector illustration.
Project schedule chart or progress planning timeline graph
Financial business statistics with bar graph and candlestick chart show stock market price and effective earning on blue background
Businessman hand show Stock chart showing rising stock sign with graph indicator. Interest rate financial and mortgage rates concept. Double Exposure Image.
Vector infographic template with 3D paper label, integrated circles. Business concept with 10 options. For content, diagram, flowchart, steps, parts, timeline infographics, workflow, chart.
Business Graph with arrow showing profits and gains
Supply and demand curves isolated on blue
Virtual reality Cyberpunk HUD interface. ci-fi digital interface elements HUD for Game, UI, UX, KIT. Futuristic User Interface, frame screens, Callouts titles.
Vector infographic circle. Cycle diagram with 3 steps. Round chart that can be used for report, business infographics, data visualization and presentation.
Large group of people standing around pie chart. People crowd. Statistic concept.
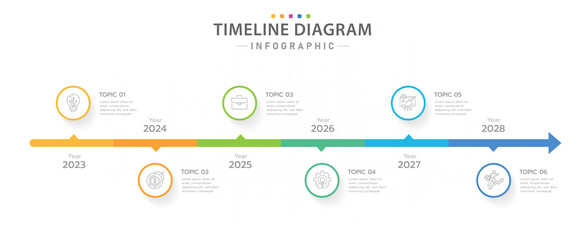
Infographic template for business. 6 Steps Modern Timeline diagram calendar with yearly topics, presentation vector infographic.
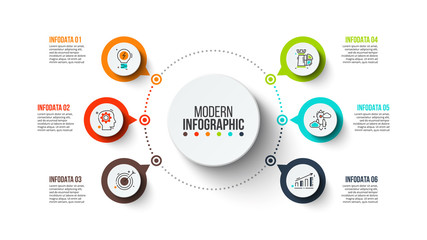
Modern Infographic Template
business pie chart cogwheel 3d illustration profit growth setting configuration connection, white background --ar 16:9 --v 6
Open book with AFFILIATE MARKETING inscription, new business concept
Vector Hexagon infographic with 6 options. Process chart design element with paper.
Business infographic Vector with 6 steps.Used for presentation,information,education,connection,marketing, project,strategy,technology,learn,brainstorm,creative,growth,abstract,idea,text,numbers,work.
Price table for websites and applications. Vector illustration
Infographic template. Vector illustration. Can be used for workflow layout, diagram, business step options, banner.
Fake and real information in the
Investment chart line icon. Gradient blur button with glassmorphism. Economic graph sign. Stock exchange symbol. Business finance. Transparent glass design. Stock analysis line icon. Vector
Trend icon sign design
Infographics vector design template.
finance background. candlesticks chart on dark screen. stock market and business investment concept
Businessman hand show Stock chart showing rising stock sign with graph indicator. A virtual screen is displayed on the tablet. Interest rate financial and mortgage rates concept.
Project Management icons set collection. Includes simple elements such as Personal Solution, Team Cohesion, Workplace, Cleverness, Contribution, and School premium icons
Infographic Design Elements for Your Business Vector Illustratio
 business concept documents
business concept documents
chart, diagram, business, graph, growth icon vector symbol illustration for mobile concept and web design
Growth icon
Growth icon
Business plan vector illustration. Tiny financial analysis persons concept.
Data circular chart vector icon isolated on transparent background, Data circular chart logo design
Abstract elements of graph Vector infographic template with label, integrated circles. Business concept with 5 options. For content, diagram, flowchart, steps, parts, timeline.

lying composition 3d icon, UI icon, a chart icon, bar chart has a rising arrow on it, bar chart, pie chart, a rising arrow, frosted glass, transparent, white background, transparent technology sense
6 77 17 percent 3d Isometric 3 part pie chart diagram for business presentation. Vector infographics illustration eps.
Financial success concept man pointing chart
Pie Chart Pixel Perfect Vector Thin Line Icon 48x48. Simple Minimal Pictogram
Candlestick chart isolated on background, sign, icon, symbol, 3d rendering.
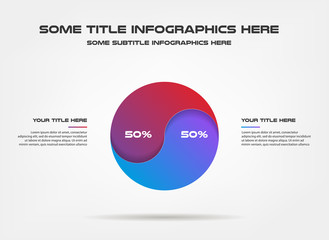
Yin Yang of percentage infographics, 50 50. Element of graph, diagram with 3 options - parts, processes, timeline. Vector business template for presentation, workflow layout, annual report, web design
Business document. Finance data
Business woman with colorful graphs and charts
Graph with decrease report. 3d diagram with recession and bankruptcy progress. Business and finance vector
Infographic design template and marketing icons.
Paper cut Magnifying glass and data analysis icon isolated on gray background. Paper art style. Vector.
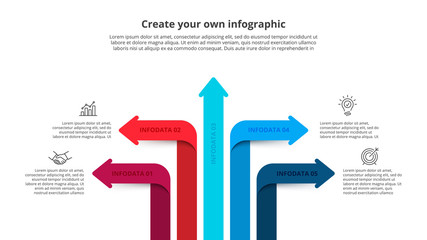
Five arrows infographic elements. Business template for presentation. Vector concept with 5 options or steps.
Modern vector 3D  illustration infographic for statistics,  analytics, marketing  reports, presentation and web design with transparent growing bar graph in blue colors.
Modern vector 3D illustration infographic for statistics, analytics, marketing reports, presentation and web design with transparent growing bar graph in blue colors.
Young beautiful slender businesswoman, secretary or top manager points to presentation. Woman in black pants and white blouses. Set of colorful diagrams, bar and pie charts. Business infographics
Swot analysis business infographic chart
 financial symbols coming from hand
financial symbols coming from hand
Dashboard, great design for any site purposes. Business infographic template. Vector flat illustration. Big data concept Dashboard user admin panel template design. Analytics admin dashboard.
Infographic business horizontal timeline steps process chart template. Vector modern banner used for presentation and workflow layout diagram, web design. Abstract elements of graph options.
blue rising busines bar graph diagram
business finance graph 3d illustration
In the conference room, there is an electronic screen on which charts and data of various types appear
Infographic design template. Business concept with 10 steps
Business graph and chart 3d rendering
Arrow up with glassmorphism effect. Pointer direction glass icon. Vector illustration
Business concept, silver pen and pencils on financial charts and graphs
Lines gradient diagram elements color infographics. Some of chart, graph, parts, processes. Vector business template for presentation. Can be used for workflow layout, diagram, banner, web design


Why Wallsheaven is special?

30 Days on Returns

You can return or replace any product within 30 days without reason.

Free Express Delivery

Delivery is free for all of our products, wherever you are.

Eco Water-Based Inks

Our prints are odorless, ecological, and safe for children with vivid colors from natural dyes.

Simple Installation

Installing WallsHeaven's wallpaper mural is as easy as making paper airplane.

Artist Support

By choosing our photos, you will support the artists from all over the world.