WallsHeaven makes decorative wall murals in high quality printing

405,614 Pattern%2Bgraphic%2Bnetwork Wall Murals - Canvas Prints - Stickers

Digital stock market graph with pink and blue lines on dark background, representing financial data and trading trends.
business graph with arrow
Abstract digital pattern with glowing lines and dots on a dark background
Economic recession graph showing downturn, hopeful growth arrow rising, CGI, Sharp Focus, High Resolution, 3D illustration
A black marker pen rests on a piece of paper with a hand-drawn bar graph showing upward growth.
A gold bar graph rising in the background with black lines and solid dark gray colors, representing stock market growth or financial success,
Stripes - checkered seamless pattern. geometric patterns. Vector
Green bar graph on a blue background, showing upward progress with an arrow symbolizing growth or financial success.
Colorful 3D bar graph against a gradient background representing data, statistics, and growth. Vibrant and modern design for business visuals. 3D Illustration.
Colorful 3D bar graph on a blue background representing data analysis, business growth, and statistical comparison in a modern design.
A bar graph illustrating the stock market's performance over time, with red and green lines representing gains and losses. Blue background.
Digital abstract data visualization with neon lines and graph patterns on a dark background.
Colorful 3D bar graph with various heights against a blue gradient background, representing business data and statistics.
Close-up view of a red financial graph on a dark background showcasing market trends and stock performance analysis. Abstract blur background.
Consumer Confidence Index: Blue Line Graphs on an Abstract Concrete Texture
A bar graph comparing profits of European retailers in different product categories.
Close-up of financial stock market graph with red and green lines, demonstrating market trends and fluctuations. Abstract blur background.
A bar graph on market performance displaying upward trends, set against a bright green background.
Abstract digital wave graph representing data trends and analytics in vibrant colors.
Consumer Confidence Index: Blue Line Graphs on an Abstract Concrete Texture
A bold graph charting stock prices against time, with vibrant reds and blues illustrating fluctuations, ideal for financial presentations.
blank paper
blank paper
Millimeter graph paper grid. Abstract squared background. Geometric pattern for school, technical engineering line scale measurement. Lined blank for education isolated on transparent background.
bright Tiles wall texture, background
Whiteboard covered in business doodles.
Bearish engulfing candlestick chart pattern. Japanese candlesticks pattern Bearish engulfing. Candlestick chart Pattern For Traders.  stock market analysis, forex analysis chart pattern.
Bearish engulfing candlestick chart pattern. Japanese candlesticks pattern Bearish engulfing. Candlestick chart Pattern For Traders. stock market analysis, forex analysis chart pattern.
Economic Indicator Graph in Serene Blue - A serene blue graph displaying economic indicators, promoting calm and stability in design.
Hand Drawing Upward Trend on Green Chalkboard
Abstract digital financial graph with fluctuating lines, modern data analysis concept.
A kaleidoscope effect made of shifting financial symbols and graphs, creating a constantly changing pattern
Economics graph, vibrant data points and trends, watercolor style
Minimalist Graph with Blue and Red Lines Showing Upward Trend and Orange Bar Chart on White Background
Hand pointing at graph on digital screen, analyzing financial data, and tracking market trends.
Graph vector illustration
White squared paper background
Textile check background. Tartan plaid texture. Pattern vector fabric seamless.
scrapbook paper with graph design on board
Caustics distortion line art vector background. Minimalistic wave concept. Optical illusion. Abstract futuristic background with zebra stripes. Twisted surface. Ripples.
scientific physics formulas and calculations icons in an interconnected concept. Science and education vector illustration.
Graph of consistent growth with calm color tones, representing steady economic stability, financial planning visualization
Digital abstract depiction of a human heart with blue and pink highlights and a heart rate graph,AI generated
Emergency ekg monitoring. Blue glowing neon heart pulse. Heart beat. Electrocardiogram
Geometric golden ornament grid on red background. Seamless fine abstract pattern, wrapping paper
Dynamic stock market graph showcasing trends in financial data with vibrant colors and digital elements.
Vibrant data visualization with colorful graphs, charts, and analytic reports depicting trends and statistics for business analysis.
Bullish harami candlestick chart pattern. Candlestick chart Pattern For Traders. Powerful Counterattack bullish Candlestick chart for forex, stock, cryptocurrency
quadratic functions graph
Abstract Red and White Circular Pattern Background
Dynamic stock market graph showcasing trends with vibrant colors and sharp lines, ideal for financial presentations.
Vibrant data visualization with neon colors showcasing a dynamic graph on a digital background.
A red line graph shows a downward trend on a black background. The graph is surrounded by a grid of white lines
Individual lost in a maze made of stock market graphs, illustrating market confusion
Currency Exchange Rate Graph in Muted Purple - A muted purple graph illustrating currency exchange rates, adding a touch of luxury to designs.
Rising stock chart on blue background Digital marketing business growth graph investment success success
Abstract voice sound wave pattern element, Voice sound wave liens and audio technology background.
Manufacturing pattern fabric textile, 50s vector tartan check. Styling plaid seamless texture background in cyan and orange colors.
Blue fabric, white pattern, hand woven fabric, cotton
Vector perspective grid. Detailed lines on white background.
Modern media publishers dream analysis report, aluminum charts and graphs, chemical brain patterns, cuttingedge layout ,8k resolution ,isolate white background
A combination of charts, graphs and signals. Abstract background
A pattern of grey and white chevron stripes running diagonally
Minimalist Graph with Blue and Red Lines Showing Upward Trend and Orange Bar Chart on White Background
White graph paper background texture
Vector system cycle set
abstract financial graph on green color background
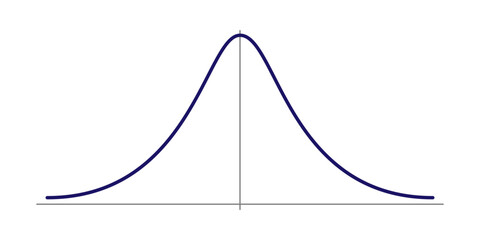
Normal Gauss distribution. Standard normal distribution. Gaussian bell graph curve. Vector illustration
Grid paper wireframe pattern textured background. Used for notes graph documents business and education.Graph, drafting paper regular square lines grid, mesh pattern.
Risk vs. Reward Analysis: A graph comparing risk and reward for different investment options.
Colorful 3D bar graph with pastel colors on a vibrant background, showcasing statistical data visualization and business analytics. 3D Illustration.
Centimeter Grid Paper with Fine Blue Lines: A Tool for Precise Measurement and Drawing
 Abstract image featuring intersecting graph and line
Abstract image featuring intersecting graph and line
A vibrant digital graph on a tablet, illustrating data trends with colorful bars and futuristic design elements.
Real Estate Market Graph: Blue & Orange Bar Chart on Minimalist Wood Grain Surface
paper spheres with graph pattern on a black and white, paper background
Economy graph showcasing dynamic financial trends, highlighting growth and decline with modern aesthetics
Plaid texture fabric of background textile vector with a pattern seamless check tartan.
Dynamic stock market graph displaying fluctuations in blue tones, representing financial trends and analytics.
A magnifying glass placed over lines of text, surrounded by digital data and holographic elements, suggesting a theme of data analysis or investigation
A red arrow pointing up on a 3D graph shows a business growing in a volatile market. ID_ae72f189-f6ce-47d3-97b0-ed5b328609de --ar 16:9 --v 6.1 Job ID: a504e235-2480-4154-8364-f25d40d152e2
Futuristic Abstract Technology Background with Dynamic High-Tech Graphs and Vibrant Data Elements
Emergency ekg monitoring. Blue glowing neon heart pulse. Heart beat. Electrocardiogram
Minimalist Graph with Blue and Red Lines Showing Upward Trend and Orange Bar Chart on White Background
Businessman Looking at Stock Market Data on a Large Screen
Dynamic red background with sleek lines representing growth and progress. Perfect for business and finance themes.
ECG chart image of medical patient, vector illustration.
Abstract background pattern featuring a rusted graph and linocut design in blue and pastel pink. Minimalistic style with emphasis on negative space.
vector checkered pattern or plaid pattern . tartan, textured seamless twill for flannel shirts, duvet covers, other autumn winter textile mills. vector format
Digital monitoring data graph with purple LED glow technology for finance and economy analysis
Green bar graph showing upward growth and progress against a blue background, representing business success and data analysis.
Fundo geométrico azul e amarelo com um padrão diagonal de quadrados texturizados
Torn grid paper piece on a transparent background. torn paper note
Graphic representation of the goniometric sine and cosine functions on the number line, sine in red and cosine in blue
Real Estate Market Graph: Blue & Orange Bar Chart on Minimalist Wood Grain Surface
 Tartan traditional checkered fabric seamless pattern!
Tartan traditional checkered fabric seamless pattern!
Abstract neon data visualization, generative ai
Throw tartan check background, upscale fabric plaid vector. Coat textile texture pattern seamless in lime and teal colors.
Green leaf in the garden....
Stock market graph abstract pattern background image


Why Wallsheaven is special?

30 Days on Returns

You can return or replace any product within 30 days without reason.

Free Express Delivery

Delivery is free for all of our products, wherever you are.

Eco Water-Based Inks

Our prints are odorless, ecological, and safe for children with vivid colors from natural dyes.

Simple Installation

Installing WallsHeaven's wallpaper mural is as easy as making paper airplane.

Artist Support

By choosing our photos, you will support the artists from all over the world.