


WallsHeaven makes decorative wall murals in high quality printing

135,651 Measure+finance+financial Wall Murals - Canvas Prints - Stickers

Financial Reports and Calculator on Desk Close-Up
Financial Management Chart #6
Green 3D bar graph showing upward growth on a blue gradient background. Business and financial success concept.
Close-up of golden coins stacked to form a bar graph, representing increasing revenue and financial prosperity, revenue growth, financial success
Low consumer spending analysis, financial crisis, economic downturn
A close-up of a person using a calculator for financial calculations with charts and documents on a desk.
Intelligence business analytics graph dashboard with digital icon analysis diagram, growth interface key performance indicators (KPI) concept.
Businessman analyzing financial data and making notes
House blueprints on site, architectural plans spread out on a construction table, Planning, residential building
Share tips for businesses to manage rising costs during inflation.
Upside Potential Stock Market Investing Growth Opportunity 3d Illustration
A close-up view of a magnifying glass over a financial graph, illustrating detailed analysis and data visualization.
Blue plastic 12-inch ruler isolated on white with clipping path
Graph bar business concept , 3d growth business graph on success financial represents profit and revenue growth.
A detailed close-up image capturing a luxurious pen placed over a financial graph paper with charts and bars, signifying prosperity and analytics.
Colorful 3D bar graph representing data analysis and statistics, ideal for business and financial presentations.
Dollar and Euro  stacks as a balance graph of  financial growth
Dollar and Euro stacks as a balance graph of financial growth
A pen and calculator placed on a financial report and newspaper, symbolizing business, finance, and investment analysis
Arrow up with graph
Arrow up with graph
pen resting on a business graph, illustrating data analysis and financial trends in a professional setting.
Coins and Currency on Financial Graph Background
Close up of graphs, pen, and glasses on financial report.
Green bar graph with upward trend and arrow on blue background, symbolizing growth, business success, and financial progress.
Business graph
Business graph
CFO implementing costsaving measures, efficient financial operations
blue measuring tape
blue measuring tape
financial chart
financial chart
Business finance and accounting concept. Businesswoman using calculator to calculate financial report
A close-up view of a balance scale with gold coins, symbolizing wealth, fairness, and financial decision-making.
Colorful bar graph on a pastel background, symbolizing growth and progress in financial metrics.
Assessment editable stroke outline web icons set. Audit, analysis, plan, evaluation, quality process, result and goal. Vector illustration
Stacks of coins with dynamic financial graphs in the background, representing investment growth and market trends.
A timeline chart with financial milestones, planning for incremental wealth building
Hand with pen writing on blue toned financial documents.
Managing expenses, implementing costsaving measures
Analyzing financial data with charts and calculator on table
Close-up of stacked coins, calculator, and financial charts illustrating money management and investment planning.
A stethoscope lays atop a financial chart, symbolizing the intersection of health and finance in modern medicine.
Stacks of gold coins in front of a financial graph on a blurred background.
Colorful pie chart on a data background, representing data analysis and business insights for effective decision making.
Close-up of a pen on graphs and charts for financial analysis.
Dollars and Measure Ruler, Close-up.  Business Сoncept.
Dollars and Measure Ruler, Close-up. Business Сoncept.
Employee wellbeing concept. Creating employee benefits and satisfaction programs. Fostering a positive work culture and employee engagement. The physical, mental and emotional health of employees.
Metallic bar graph showing increasing growth on a bright turquoise background
Close-up of financial charts and graphs with a pen on a desk. Ideal for business presentations and analytics.
Coins and graph with 'monetary policy' text, representing economic strategy and financial regulation.
financial graph 3d background
Business finance and accounting concept. Businesswoman using calculator to calculate financial report
money diet
money diet
Time and Money: The Value of Time in Currency
A hundred dollar bill in a Vice Clamp
Elegant gold bars positioned on a dark surface, reflecting market trends with a dynamic background of financial data analysis.
Businessman pointing arrow. Concept of business success, Influencer, Opinion leader and benchmark
Close-up of a pen over financial graphs and charts.
money balance concept
analytics information or data icon, linear sign isolated on white background - editable vector illustration eps10
Vibrant financial growth concept featuring stacked coins and colorful bars representing economic trends and profit.
An arrangement of rulers, scales and measuring tools suggests concepts of measurement, metrics, precision, accuracy and results.
Close up of two stacks of gold coins on a scale, one on each side.
business graph
business graph
Colorful Chart Bars on Financial Graph Background
inflation
inflation
A digital graph coming out of a tablet, with lines and bars growing upward, visualizing the concept of tracking and measuring ROI
close up businessman hand using stylus pen on screen dashboard of graph and chart statistics data for analyzing about profit monthly , business and financial concept
Scales. 3d
Scales. 3d
hand holding a pen, drawing a blue graph line on financial paperwork, symbolizing growth and analysis.
Risk level indicator rating print screen wooden cube block since low to high on yellow background for Risk management and assessment concept.
Dollar and Euro  stacks as a balance graph of  financial growth
Dollar and Euro stacks as a balance graph of financial growth
Close-up of a fountain pen resting on financial documents with charts and graphs, symbolizing business and investment strategies.
Protecting data, networks, and financial transactions with cybersecurity measures and encryption
Risk manage, Business risk assessment. Businessman assess investment, Safety control risk. Reduce opportunity for financial investment, projects, manage business. Manage low level strategy.
Business planner with financial forecasting charts spread over a desk, forecasting analysis, business growth, strategic operations
Consumer price index CPI is shown using the text
business stat background
Businesswoman Measuring Piggybank With Measuring Tape
Businessman at the executive level analyzes the work strategy of the organization. Measure success with KPI, improve performance. Investigate and correct deficiencies, measure results concretely.
Audit, financial report and research. Document of analyze with chart of result. Icon for data, auditor and verification. Audit paper for accountant. Sheet of tax, risk and control. Vector
3D infographic of loan interest rates with dynamic visuals, financial planning, digital transparency
Wooden blocks with number 2025 on a desk with financial graphs in background.
Set of financial analytics or metrics icons, business research. Analytics information, data. Business-analysis symbols. Vector illustration.
Graphs showing economic uptrend with blue and orange lines, highlighting positive growth and improving financial trends.
inflation
inflation
Electricity meter with day and night tariff
businessman hand touch virtual graph,chart, diagram
Vernier caliper with coins, calculator and pen on documents with financial data. Business and financial concept.
A Silver Scale Hanging Over A Financial Form
Finance Growth
Finance Growth
Business graph
Business graph
close-up view of russian rubles banknote with measuring tape on grey, financial crisis concept
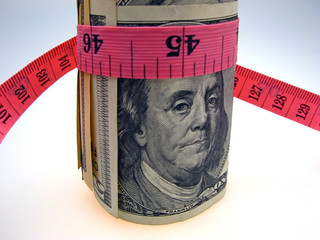
dollars with measure tape
Piggy bank and tape measure
financial report and graph
ROI Return On Investment boost concept with person choosing to increase financial asset portfolio performance and improve profitability. Enhance capital efficiency.
concept measures accumulation
Rulers and scales in metric and inches represent measurement, accuracy and results with copy space. Graphic indicates large numbers at base declining to smaller at top.
Notepad with word productivity and glasses.
Financial Freedom the Good Life Words on Calculator
Stack of cash, US dollars, with measuring tape, against white background.


Why Wallsheaven is special?

30 Days on Returns

You can return or replace any product within 30 days without reason.

Free Express Delivery

Delivery is free for all of our products, wherever you are.

Eco Water-Based Inks

Our prints are odorless, ecological, and safe for children with vivid colors from natural dyes.

Simple Installation

Installing WallsHeaven's wallpaper mural is as easy as making paper airplane.

Artist Support

By choosing our photos, you will support the artists from all over the world.