

WallsHeaven makes decorative wall murals in high quality printing

9,621,466 Map%2Bdesign%2Bbackground Wall Murals - Canvas Prints - Stickers

Colorful data analytics and business report illustration with graphs, charts, and office supplies on a turquoise background.
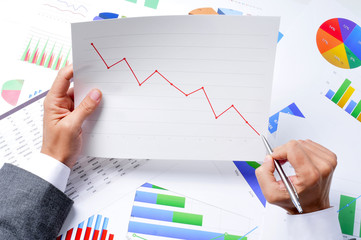
businessman observing a chart with a downward trend
Young thoughtful lady is searching something in the internet using the tablet. Financial charts and office view in blur on the background.
株価の下落グラフイメージ赤色レッド
株価の下落グラフイメージ赤色レッド
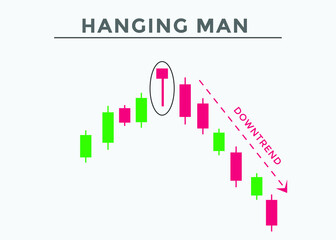
Hanging man candlestick chart  pattern. Trading signal Japanese candlesticks pattern. Powerful bearish Candlestick chart for forex, stock, cryptocurrency.
Hanging man candlestick chart pattern. Trading signal Japanese candlesticks pattern. Powerful bearish Candlestick chart for forex, stock, cryptocurrency.
下降する3Dの矢印と棒グラフを虫メガネで見る
Financial portfolio, minimal design, growth, flat charts and graphs
Color Bridge Coated CMYK. Color Chart. Print Test Page. Color Numbers or Names. RGB, CMYK, Pantone. Vector color palette.
Increasing bar charts png, minimal line art illustration, transparent background
Circle division infographic icon set. Pie chart divided 8,9,10 equal parts. Pizza or flower round diagram. Infographic wheel segment and fraction. Vector illustration isolated on white background.
Beautiful business woman in a strict business suit against the background of financial charts and graphs. Economic chart, analysis of global economic trends.
28 30 42 percent 3d Isometric 3 part pie chart diagram for business presentation. Vector infographics illustration eps.
Home office of trader work online on computers with financial graphs charts make investment online. Empty workplace desk table with PC, trade on web.
Stock financial index growth in stock market investment with graph and chart on new growth startup life of small tree image background with bright light.
Graph charts that are 3D models are inside the office. Show financial balance. AI generated.
charts and graphs with statistics to innovative analyze business potential and forecast future development of companies growth.
Infographic isometric pie chart template. Share of 90 and 10 percent. Vector illustration.
Financial charts and graphs. 3d render ..
Business charts and graph
8分割したカラフルで使いやすいシンプルな円グラフ
Financial specialist. Economic charts near trader with tablet. Cropped investor. Trader makes investment transaction. Businessman trading in stock exchange app. Trader near blurred skyscrapers
Loss money on computer stocks graphs, vector illustration, flat cartoon pc and cash charts down arrow on screen, concept of unsuccessful financial trading, bad revenue or economy budget fail
Marketer or analityc manager team working on paper charts at the table. Image focused on the documents
papers charts success of business
世界地図と上昇グラフと矢印
世界地図と上昇グラフと矢印
グラフ
グラフ
Multi exposure of virtual creative financial chart hologram on empty modern office background, research and analytics concept
Data analysis, Progress success, Intelligence, Good financing, Stock market, Cryptocurrency trade, Business growth concept. Businessman touch arrow and show virtual investment charts diagrams.
business finance graph 3d illustration
Business candle stick graph chart of stock market investment trading on white background design. Bullish point, Trend of graph. Vector illustration
sale reprt with chart document
Technical price graph and indicator, red and blue candlestick chart on blue theme screen, market volatility, up and down trend. Stock trading, crypto currency background. by ai generative
growing written on blackboard with chart up
Set graph diagram up icon, business growth success chart with arrow, business bar sign, profit growing symbol on white background..eps
Graph charts that are 3D models are inside the office. Show financial balance. AI generated
charts and graphs with statistics to analyze business potential and forecast future development of companies growth.
On the background of interactive forex charts there is a marker and a sticker with the inscription - soldiers pattern
Financial charts and graphs. 3d render .
A stock market candlestick chart showing a sharply declining and crashing price going deep into the red
12分割したカラフルで使いやすいシンプルな円グラフ
Analyst is drawing a financial calculations and predictions on the glass screen. Graphs, charts and arrows everywhere. A concept of forex market.
Business man holding smartphone with chart symbols
Financial graphs and charts
businessman's hand rawing oganization chart
ビジネスイメージ グラフ
ビジネスイメージ グラフ
Bilateral pattern of stock chart compilation
3D素材_シンプルな棒グラフ
3D素材_シンプルな棒グラフ
Hand, growth and chart with drawing, closeup and office for planning, analytics and ideas for investing. Finance employee, pen and board for innovation, stats and vision with graph for stock market
Icon set about graph business chart, Illustration of bar graph, line graph, pie graph.
Calorie density banner. Healthy eating concept. Editable vector illustration
Modern infographic template with stock diagrams and statistics bars, line graphs and charts for finance report. Diagram template and chart graph,UI and UX Kit with big data visualization. Vector
RISE and FALL antonyms word card vector template. Flashcard for english language learning. Opposites concept. Drawing charts on the chalkboard
various measurement table chart
Abstract digital growing arrows up graph chart on technological blue low poly wireframe background. Boosting of business result concept. Polygonal finance glowing illustration. Success and Investmen
charts and graphs with statistics to analyze business potential and forecast future development of companies growth.
Various financial documents, graphs, reports, 3d, pie charts, 3d chart with arrow, Ai generated image
Business candle stick graph chart of stock market investment trading on white background design. Bullish point, Trend of graph. Vector illustration
Vector : Candle sticks and bar chart with arrows on business bac
3D pie chart icon with transparent background, perfect for template design, UI/UX and more.
3d businessman hands holding coin with charts and graph
Infographic design template. Organization chart with 6 people
Business stock market, trading, info graphic with animated graphs, charts and data numbers insight analysis to be shown on monitor display screen for business meeting mock up theme
businessman drawing stock chart
Financial documents
Financial documents
高層ビルとグラフ
高層ビルとグラフ
チャート図
チャート図
Colorful 3D computer setup displaying colorful graphs and charts with vibrant geometric shapes on a blue background
Businessman vault jumping over bar charts
Golden coin piles with growing stock charts
Candlestick graph chart with digital data, uptrend or down trend of price of stock market or stock exchange trading, investment and financial concept.
ビジネスアイコン「上昇するグラフ」
ビジネスアイコン「上昇するグラフ」
スマートフォンとグラフ資料
スマートフォンとグラフ資料
Europe Map Silhouette Vector illustration
business man drawing the financial bar charts showing growing revenue on touch screen
charts and graphs with statistics to analyze business potential and forecast future development of companies growth.
data analysis icon with colorful graph charts isolated on a white background
3Dグラフ チャートイラスト
3Dグラフ チャートイラスト
右肩上がりの直方体グラフ
右肩上がりの直方体グラフ
Stock market trading graph and candlestick chart on screen monitor background. Financial investment and economic concept.
Minimal abstract financial or business chart - concept graph with copy space
棒グラフと矢印
棒グラフと矢印
Eighty four 84 Sixteen 16 3d Isometric pie chart diagram for business presentation. Vector infographics illustration eps.
1120 tax forms closeup with calculator and colorful charts
ナチュラルボードに木の板でグラフイメージと右上がりの矢印
ビジネスマン 分析 グラフ
ビジネスマン 分析 グラフ
グラフとビジネスマン
グラフとビジネスマン
Colorful 3D bar charts displayed on a digital screen with vibrant lighting, representing data analysis, business growth, technology, and futuristic financial insights
A minimalist bar chart trending upwards, signaling financial prosperity.
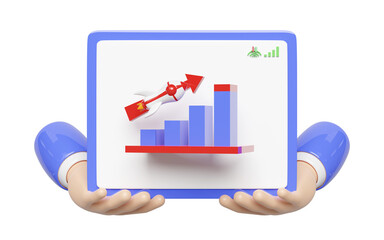
3d charts graph with hands, tablet, rocket, arrow, analysis business financial data. business strategy concept, 3d render illustration
Business strategy growth digital technology. Stock trading. Digital graph chart increase. Business on successful. Low poly diagram wireframe.


Why Wallsheaven is special?

30 Days on Returns

You can return or replace any product within 30 days without reason.

Free Express Delivery

Delivery is free for all of our products, wherever you are.

Eco Water-Based Inks

Our prints are odorless, ecological, and safe for children with vivid colors from natural dyes.

Simple Installation

Installing WallsHeaven's wallpaper mural is as easy as making paper airplane.

Artist Support

By choosing our photos, you will support the artists from all over the world.