
WallsHeaven makes decorative wall murals in high quality printing

583,494 Information+finance+plan Wall Murals - Canvas Prints - Stickers

Infographic circle 5 processes to success. Vector illustration.
People work with light bulb diagram of innovation project vector illustration. Cartoon managers research infographic business charts, plan success solution and finance strategy, brainstorm teamwork
Business Infographic Template Creative Design with Abstract Label Icon and 4 Option for Presentation
Business hierarchy structure. 
Relations of order or subordination between members. Business process and workflow automation with flowchart. Virtual screen Mindmap or Organigram.
Business hierarchy structure. Relations of order or subordination between members. Business process and workflow automation with flowchart. Virtual screen Mindmap or Organigram.
Focus on smart phone with icon bar on screen with credit card and bank statement, many bill and  from buying via credit card, Online shopping concept
Focus on smart phone with icon bar on screen with credit card and bank statement, many bill and from buying via credit card, Online shopping concept
Financial charts on office desk with laptop, home office work space. financial accounting strategy analysis concept
Coworkers discussing working moments and checking financial report in conference room
Business strategy, digital marketing plan, business and technology concept
Abstract arrows of graph, diagram with 7 steps, options, parts or processes. Vector business template for presentation.
Business data analytics process management with businesswoman hand touching connected gear cogs with KPI financial charts and graph and automated marketing dashboard.
Business growth analysis with a computer keyboard and office items
Infographic design template. Creative concept with 6 steps
Statistical tools in research and data analysis. Vector isometric illustration
Strategy Implementation on jigsaw puzzle
Man using laptop at workplace
Abstract vector collection of colorful flat business and finance icons. Design elements for mobile and web applications.
Analyzing Financial Data with a Pencil
The concept of business, technology, the Internet and the network. Virtual screen of the future the inscription: Execute.
Business, Technology, Internet and network concept. Digital Marketing content planning advertising strategy concept. 3d illustration
Team, meeting and paper in office for business, marketing strategy and finance management. Corporate people, woman speaker and discussion at table with report, feedback or planning for upcoming audit
Colorful accounting text with handwritten notes and calculations
Business Infographic Template Design with Square Label Icon and 4 Option for Presentation
Advanced Product Analysis Concept with Detailed Charts and 3D Product Icons in High-Quality.
3d pie chart sitting on reflective surface illustrating market share
A business person in a checkered shirt holds a smartphone displaying financial graphs and charts, analyzing data for business performance.
Close-up of a hand-drawn business plan on a chalkboard, creative business strategy
Data-Driven Decisions: Two sharpened pencils rest atop a financial report, emphasizing strategic analysis and planning in business.
Businessman analyzing financial data on futuristic holographic interface
Blurred Financial Report on a Sunlit Desk with Plant
AIDA infographic presentation layout fully editable.
analytics and monitoring concept, web reporting dashboard and data analytics research for business financial planning. Flat vector illustration design on background.
Vector Infographic Element Design Template.
Business infographic element with 3 icon options
A colorful graph with many lines and numbers
businessman uses a tablet to analyze sales data. He appears focused as he reviews charts and graphs, symbolizing strategic planning, financial analysis, and decision-making in a corporate setting
Strategy and Innovation Planning: Chess Competition with Financial Stock Background
Graph chart on black background. Business graph bar.
Internet, business, Technology and network concept. Digital Marketing content planning advertising strategy concept. 3d illustration
Spreadsheet document information financial startup concept. data and graphs in spreadsheet documents for online analysis project dashboard accounting digital snugly 3D illustration
marketing image, bright colors, digital marketing. close up of digital clock with digital numberw
Image of statistics and financial data processing over office
Minimal Business Infographic Template Design with Abstract Label Icon and 4 Number for Presentation
Woman in glasses digital projects development talking on mobile phone and reading information on web page on laptop computer. Female marketing writer having cellphone conversation using net-book
business concept:mobile work
businessman working with digital laptop computer and smart phone
Flat Bundle Marketing Planning Site Design Illustration
Vector circle arrows infographic, cycle diagram, geometric graph, presentation chart. Business concept with 7, options, parts, steps, processes. 16x9 slide template.
Set of geometric elements divided into 3, 4, 5, 6, 7 and 8 options. Templates of cycle infographics
Business by Cloud computing technology for business analysis
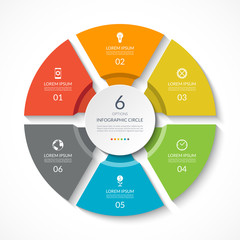
Infographic circle. Process chart. Vector diagram with 6 options. Can be used for graph, presentation, report, step options, web design.
analytics and monitoring concept, web reporting dashboard and data analytics research for business financial planning. Flat vector illustration design on background.
Benchmarking. Compare quality with competitor companies. Performance, quality, cost comparison. Development strategy
infographic template 6 step 6 year plan for business direction, marketing strategy, diagram, data, growth, arrow timeline, for presentation report and progress
Vector Infographic design business template with icons and 6 options or steps. Can be used for process diagram, presentations, workflow layout, banner, flow chart, info graph
businessman uses a tablet to analyze sales data. He appears focused as he reviews charts and graphs, symbolizing strategic planning, financial analysis, and decision-making in a corporate setting
Strategy and Innovation Planning: Chess Competition with Financial Stock Background
Close-up male hands writing in notebook with pen make notes information financial analysis startup project management idea sitting at desk in office using laptop unrecognizable middle-aged businessman
Career ladder. Young man, businessman, finance analyst or clerk in business clothes isolated on purple background. Concept of finance, economy, professional occupation, business, ad.
Vector infographic template
marketing image, bright colors, digital marketing. close up of digital clock with digital numberw
Data analytics website banner thin line vector illustration
Piggy Bank With Question Mark On Black Board
Business ideas
Business ideas
Red arrow on business graph
Businessman working with financial newspaper and digital tablet on desk in office, close-up hand holding pen writing information to document chart data, graph, and business growth concept background b
An upward graph line illuminates a dark, futuristic backdrop, showcasing economic growth, market progression, and optimistic financial trends.
Laptop with Charts and Graphs
Data Analysis and Financial Charts
Open binder with a business plan and financial data, organized business strategy
Close-Up of Hand Analyzing Business Data on a Colorful Chart with Pen and Sticky Notes on Wooden Desk
Business financial advisory services concept. Business teamwork and working on digital laptop computer with advisor showing plan of investment to clients at table office. Digital marketing.
Vector Infographic design illustration business template with icons and 9 options or steps. Can be used for process diagram, presentations, workflow layout, banner, flow chart, info graph
businessman uses a tablet to analyze sales data. He appears focused as he reviews charts and graphs, symbolizing strategic planning, financial analysis, and decision-making in a corporate setting
Financial Data Analysis
Business Data Analyzing
On the yellow surface is a marker, question marks and a sticker with the inscription - HOW MUCH COVERAGE DO I NEED
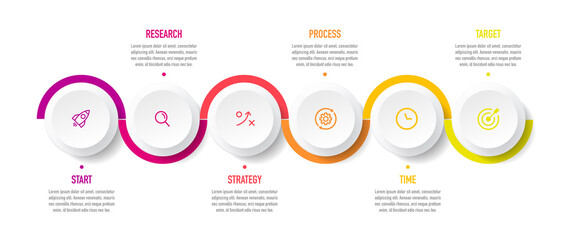
Timeline infographic design with 6 options or steps. Infographics for business concept. Can be used for presentations workflow layout, banner, process, diagram, flow chart, info graph, annual report.
marketing image, bright colors, digital marketing. close up of digital clock with digital numberw
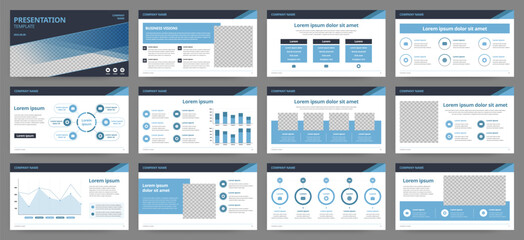
Modern presentation slide templates. Infographic elements template set for web, print, annual report brochure, business flyer leaflet marketing and advertising template. Vector Illustration.
Concept financial transactions online, businessman use laptop with point at financial analyzing data while discussion, planning brand promotion budget, raising company awareness in social media
Trading graphics background
infographic 8 steps business management to success rounded polygonal color sections multicolored letters in center corner icons gray gradient background design for marketing, product, project
Bullish Trends in the Stock Market. AI Generated
Business, finance and occupation concept. Man doing analysis behind multiple screens showing charts and statistics. Stock, crypto, forex, financial market research. Cityscape at night in background
Business analytics and financial concept, Businessman using computer for analysis and plans to increase business growth and an increase in the indicators of positive growth in the future.
Financial planning chart with backgound of man showing woman information in a binder.
Analysis success business financial growth data chart market statistics or investment finance stock graph report diagram and magnifying glass analytics money on digital marketing profit 3d background.
Business team working marketing growth on financial document graph report statistics, using post it notes in glass wall to writing strategy business plan to development grow to success
Business 2 option infographic presentation vector 3D colorful balls illustration. Corporate marketing analytics data report design layout. Company statistics information graphic visualization template
Technology and financial advisory services concept. Business teamwork and working on digital laptop computer with advisor showing plan of investment to clients at table office. Digital marketing.
Vector Infographic design business template with icons and 3 options or steps. Can be used for process diagram, presentations, workflow layout, banner, flow chart, info graph
businessman uses a tablet to analyze sales data. He appears focused as he reviews charts and graphs, symbolizing strategic planning, financial analysis, and decision-making in a corporate setting
The business report icon. Audit and analysis, document, plan symbol. Flat
Data Analysis Report, Charts and Graph


Why Wallsheaven is special?

30 Days on Returns

You can return or replace any product within 30 days without reason.

Free Express Delivery

Delivery is free for all of our products, wherever you are.

Eco Water-Based Inks

Our prints are odorless, ecological, and safe for children with vivid colors from natural dyes.

Simple Installation

Installing WallsHeaven's wallpaper mural is as easy as making paper airplane.

Artist Support

By choosing our photos, you will support the artists from all over the world.