


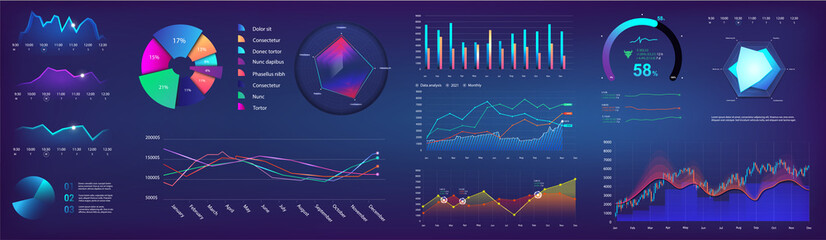


infographic graph
Wall muralchart business vector
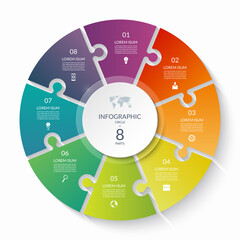
Wall muralelement datum template
Wall muralgraphic design information
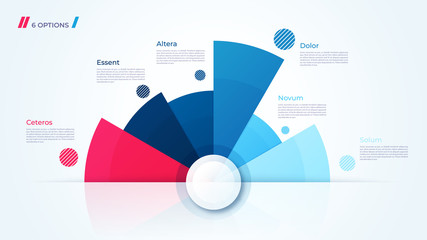
Wall muraloption concept step
Wall murallayout illustration process
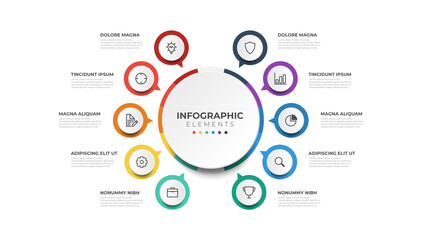
Wall muralcircle icon marketing
Wall muralbanner symbol info
Wall muralinfographic
Wall muralgraph
Wall muralchart
Wall muralbusiness
Wall muralvector
Wall muralelement
Wall muraldatum
Wall muraltemplate
Wall muralgraphic
Wall muraldesign
Wall muralinformation
Wall muraloption
Wall muralconcept
Wall muralstep
Wall murallayout
Wall muralillustration
Wall muralprocess
Wall muralcircle
Wall muralicon
Wall muralmarketing
Wall muralbanner
Wall muralsymbol
Wall muralinfo
Wall muralweb
Wall muralabstract
Wall mural


