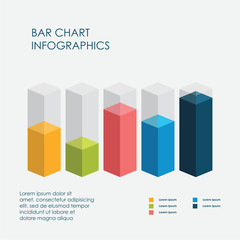
WallsHeaven makes decorative wall murals in high quality printing

751,122 Graph+profit+analysis Wall Murals - Canvas Prints - Stickers

Financial gold graph stock money investment finance business on growth currency insight chart market 3d background of success profit concept golden exchange economy trade wealth banking price diagram.
Stock market investment trading graph in graphic concept suitable for financial investment or Economic trends business idea. Vector illustration design
Illustraton of cost and profit charts
Investment stock market Entrepreneur Business team discussing and analysis graph stock market trading,stock chart concept
Growth.Multi Color edition.Financial doc,3d graph.Frosted glass
Magnifying glass on charts graphs paper. Financial development, Banking Account, Statistics, Investment Analytic research data economy, Stock exchange trading, Business office company meeting concept.
Businessman using tablet analyzing sales data and economic growth graph chart. Business strategy. Abstract icon. Digital marketing.
Businessman plan the growth. Investment with financial chart, Growth and successful concept.
Stock market graph trading analysis investment financial, stock exchange financial or forex graph stock market graph chart business crisis crash loss and grow up gain and profits win up trend.
3D growth graph with arrow up, investment profit increase business strategy concept
Stock crash market exchange loss trading graph analysis investment indicator business graph charts of financial digital background down stock crisis red price in down trend chart fall
Miniature People: Business man looking at analyst graph with copy space using as background money, financial, business concept.
Financial analysis
Illustration of a Business Growth Graph on a Blackboard
A close up of a paper with a graph on it
Businessman drawing graph growth and analyzing financial investment data, strategy and planing on blue background.
Magnifying glass and documents with analytics data lying on tabl
3d minimal data analysis icon. soaring finances. stock up. Strengthening currency. smartphone with bar graph and arrow up. 3d illustration.
purple business charts, graphs, data and report summarizing back
Stock market trading graph and candlestick chart for financial investment concept. Abstract finance background.
Growth business graph finance data diagram concept on stock market background with financial investment economy analysis chart or increase profit economic strategy success goal motivation development.
audit and data analysis icon like thin line assesment. linear trend graphic stroke design lineart logotype web element isolated on white. concept of key performance indicator or business visualisation
Business audit stock financial finance management on analysis data strategy with graph accounting marketing or report chart economy investment research profit concept.data, audit, graph, analysis.
concept of interest rates and dividends,financial interest rate growth chart,percentage increase in investment and deposit interest rates ,financial graphical and statistical analysis ,targeting
stocks, bonds analysis, planning, strategies, financial institutions
Financial chart with uptrend line graphs and candlesticks. Futuristic network or business analytics.  graph chart of stock market investment trading on blue background.
Hand of Business people working document about budget profits and planning of construciton project
top view of color analytical graph on white background
Crisis. Graphs and charts templates. Business infographics. Statistic and data, bankruptcy, financial crisis, money loss, down arrow, economy reduction. Financial chart. Vector illustration.
Business growth concept, show marketing graph analyzing stock market changes with achieve the target marketing
break even point or BEP or Cost volume profit graph of the sales units and the revenue sales
Company accounting documents black and white 2D line object. Marketing statistics isolated vector outline item. Job performance. Financial profit graphs pie charts monochromatic flat spot illustration
 business finance investment background and banner
Office interior with graphs and diagrams
Financial technology and business analytics concept analysis of a financial graph growth chart. generative ai
Finance and accounting, business analysis concept. Businessman analyzing business data, financial grpah report, budget and tax management, economic grwoth, strategy, planning and solution
a green graph with lines and dots
MUTUAL FUNDS business stock profit growth investment money income mutual banking asset economy interest mutual fund coins money saving
3D Bar graph chart showing growth with arrow
Blue stock exchange market graph on LED screen for business analysis. Finance and economic graphs.
Gold trade chart stock analysis on growth financial business money market 3d background with profit investment exchange graph data concept and global economy currency diagram price marketing research.
Business economic show growth graph on screen tablet concept digital technology stock market  strategy arrow data upward.
White office desk
Growing bar graph icon set. Business graphs and charts icons. Statistics and analytics  Outline icon. Statistic and data, charts diagrams, money, down or up arrow.
Economic collapse concept, businessman with falling financial graph chart due to global recession. Stock market crash, inflation, financial crisis, Falling income in GDP, capital reduction, loss of
Low poly wireframe of Business holding tablet and showing holographic graphs and stock market statistics gain profits in form of line, dot, and low polygon. Concept of growth planning and strategy.
Bar Chart Infographics Elements 3D Vector Flat Design, Sign, Icon Full Color, Template
Stock market investment graph for profit.  Candles chart with rising arrow for business and financial gain on wall street.  Conceptual market intelligence.
Digital screen with business statistics and stock data.
Computer Monitor displays financial reporting infographics, including various charts, stock growth, and messages on the screen. Flat vector illustration
blue graph and chart reports on office table
Business invest with growth graph for ESG or ecology problem concept; business invest energy sources. Preserving resources of planet
Close-up of a financial report with graphs, charts, and key indicators for insights into performance.
Investment stock market Entrepreneur Business Man discussing and analysis graph stock market trading,stock chart concept
Financial statistics documents on clipboard pad at office table closeup
Finance trade manager analysing stock market indicators for best investment strategy, financial data and charts with business buildings in background
business report diagram analysis chart icon set marketing performance graph statistic growth data vector illustration for web and app
Drawing of graph on blackboard
Businessman pointing arrow graph corporate future growth plan. Business development to success and growing growth year 2021 to 2022 concept
Stock market exchange loss trading graph analysis investment indicator business graph charts of financial board display candlestick crisis stock crash red price chart fall money -
Abstract infographics documents and 3D graphs and charts.
Business candle stick graph chart of stock market investment trading on blue background. Bullish point, Trend of graph. Eps10 Vector illustration.
Financial crisis stock chart business on economy market background with down diagram money exchange finance graph or loss global investment trade analysis recession and fall sales price crash risk.
Stock market digital graph chart on LED display concept. A large display of daily stock market price and quotation. Indicator financial forex trade education background.
Hi-tech hologram of growing graph chart on blue background. Digital low poly wireframe vector illustration. Abstract stock market investment trading concept. Business finance investment graph growth.
Stock market finance business, economy trend graph digital technology.
Businessman analyzes the graph of trend market growth in 2024 and plans business growth and profit increase in the year 2024. plan finances of the business
Financial background, forex chart trading graph idea, vector illustration. Neon market growth graph, analysis tools conceptual background. Investment monitor diagram, stock data.
Business graphs and charts on table. Financial development, Banking Account, Statistics
Stock market, Business growth, progress or success concept. Businessman or trader is showing a growing virtual hologram
Graph up concept
Business candle stick graph chart of stock market investment trading on white background design. Bullish point, Trend of graph. Vector illustration
Calculator on financial statement and balance sheeet on desk of auditor. Concept of accounting and audit business.
Drawing a profit chart with chalk on a blackboard.
Concept of proft and loss with businessman
3D realistic arrow up. Arrow show success of business strategy
Finance and accounting concept
abstract financial chart with uptrend line graph and candlestick on black and white color background
Business development to success and growing growth concept, Businessman pointing arrow graph corporate future growth plan
Office infographics showing growth rates, sales, profits or revenues. The result of business training.
Glowing forex chart wallpaper
Businessman business graph in hand on virtual screen. Planning and analyzing business and financial growth. Business incremental growth concept design
Money growth business graph economy finance stock or currency investment financial diagram profit chart of global exchange market price shares on economic analysis 3d background with success trade.
Business success growth metaverse finance and investment profit graph concept or development analysis progress chart on financial market achievement.
Growth bar chart with columns and upward arrow, trading up. Financial stock market, data analysis and business concept. 3d vector icon. Cartoon minimal style.
Business candle stick graph chart of stock market investment trading . Bullish point, Trend of graph. Vector illustration
Stock market digital graph chart on LED display concept. A large display of daily stock market price and quotation. Indicator financial with buildings background
Composite collage picture image of funny man graph working process data analysis startup unusual fantasy billboard comics zine
Business audit stock financial finance management on analysis data strategy with graph accounting marketing or report chart economy investment research profit concept. Generative AI
Businessman analysing economic growth graph financial data on laptop. Stock market investment.  Financial and banking Technology. Business strategy and digital marketing concept.
3d minimal data analysis. business planning. business visualization. statistical analysis. web browser with statistical graph pages. 3d illustration.
Financial growth arrows graph. Investment and trading concept.
The workplace of the financier, graphics on paper, analysis forex
Working together for growth
Graphic
Financial chart and coins
Financial growth, revenue graph, vector illustration. Trend lines, columns, market economy information background. Chart analytics strategy concept, trendy black and white, monochrome style.


Why Wallsheaven is special?

30 Days on Returns

You can return or replace any product within 30 days without reason.

Free Express Delivery

Delivery is free for all of our products, wherever you are.

Eco Water-Based Inks

Our prints are odorless, ecological, and safe for children with vivid colors from natural dyes.

Simple Installation

Installing WallsHeaven's wallpaper mural is as easy as making paper airplane.

Artist Support

By choosing our photos, you will support the artists from all over the world.