




WallsHeaven makes decorative wall murals in high quality printing

1,331,325 Graph+market+success Wall Murals - Canvas Prints - Stickers

Data analysis, Business intelligence (BI), business analytics (BA) with key performance indicators (KPI) dashboard concept with financial graphs and market report
Digital financial chart indicators, stock market business and exchange financial growth graph.
Candlestick chart graphs and gold bars buying and selling gold bullion upward arrow graphs.
The graph shows the stock market price rises. But when the coronavirus, covid 19 or Wuhan outbreak caused the stock price to fall affect worldwide. Stock market crisis price arrow down like a rocket
Financial trade concept. Stock market and exchange. Candle stick graph chart.
Business growth or goal concepts with female hand puting arrow wood box on yellow
Mission sign icon of business company management with simple text isolated on white background. Web page or presentation item template. Abstract line grown chart graph vector sign. V5 form SET5
Concept of business analysis
success graph illustration
Businessman analyzing sales data, market report with economic growth chart, financial graph, Business strategy and planning, Digital marketing and stock market analysis
chart with growth arrow icon on white background. flat style. chart progress sign. orange arrow on business graph symbol. growing graph sign.
Two graphs isolated on white
Double exposure of stock market graph with man working on laptop on background. Concept of financial analysis.
Ordinary office day. Team of stockbrokers works in indoors with many display screens
3d infographics element. Realistic arrows and chart render. Business growth strategy concept
Crisis and growth analytics. Business analyst, financial stabilization and sales arrow graph prediction. Development, stock or investment analytics statistics flat vector illustration
business target arrow graph profit rise arrow goinf forward
money graph 3d illustration isolated on white background
Bar chart with indicators and data on table background
Business people meeting explaining the financial graph data and marketing plan. Group of business people at meeting assessment the state of business investment and marketing.
Investing and stock market concept gain and profits with faded candlestick charts.
Abstract business graph
Stock market graph and ticker for businese analysis on LED screen monitor. Finance, Investing and exconomic concept.
Big target icon on top of wooden cube block stack with shopping cart icons and huge growth line graph arrow on white background with copy space. Business marketing success and profit income concept.
business graph showing growth
Financial trade concept. Stock market and exchange. Candle stick graph chart.
blue rising busines bar graph diagram
Two diverse traders brokers stock exchange market investors discussing crypto trading charts growth using digital tablet and laptop analyzing financial risks, investment profit, global rates forecast.
Growth arrow gold coin currency price on money business finance 3d background with success financial market investment earning graph or economy concept cash profit chart and increase stock up symbol.
3d blue graph
3d blue graph
Dynamics of market sales
Businessman hand pointing pencil to stock market graph on graph
Multi exposure of stock market graph with man working on laptop on background. Concept of financial analysis.
Stock market or forex trading graph in graphic concept suitable for financial investment or Economic trends business idea and all art work design. Abstract finance background
business man drawing graph of sales
Human character and graph
Stock market graph online business. stcok exchange concept. Digital illustration.
competition of two silhouette of businessman running with arrow. business concept for competition
Businessman drawing strategy concepts
Translucent glass abstract geometric background, different colors
stock market exchange graph illustration
Business graph icon isolated on white background. Downside trend graph, bar chart image with arrow down. Vector illustration for banner, template, poster, postcard, web, app
Business development, financial plan and strategy.Arrow up with graph of business analysis.
multicolor 3D arrow going up graph vector illustration represents business profit economic boom financial grow
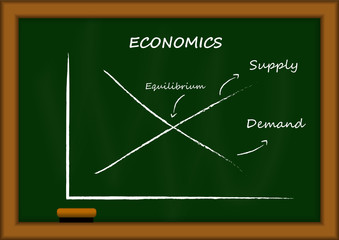
Vector : Demand and supply Economics graph on blackboard
3D arrow
3D arrow
Stock market and trading digital graph
bar chart shows business growth information for strategy planning and uptrend line graph with light dot on blue background with copy space
low poly abstract blue gowing down chart
Blue Arrow Business Growth Graph
Man drawing growing graph in blue on the wall symbolizes business progress and success
Forex chart on cityscape with skyscrapers wallpaper multi exposure. Financial research concept.
Rows of gold coins for finance and banking concept
concept of interest rates and dividends,financial interest rate growth chart,percentage increase in investment and deposit interest rates ,financial graphical and statistical analysis ,targeting
Little boy thinking about startup
Business graph on a blackboard
Goal business success strategy chart target or creative growth arrow achievement diagram and presentation finance marketing graph on development background with pointing financial profit stock market.
Global business finance GDP graph chart report stock exchange market trading investment and businessman data analytics big data, technology business client analysis management. Generative AI.
business bar graph diagram with rising arrow
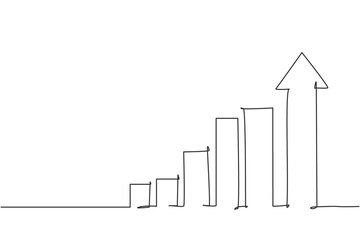
Single one line drawing of increasing up arrows bar graph sign. Business financial sales market growth performance minimal concept. Modern continuous line draw design graphic vector illustration
Businessmen celebrating exponential growth with a rising graph and paper airplane, symbolizing success, teamwork, strategy, innovation, and progress.
Analyzing Coronavirus covid-19 with financial data and stock graph. Analysis of numerical data and stock market communication with businesses worldwide. Stop Novel Coronavirus outbreak covid-19.
Candlestick signal to buy or sell in crypto trading or stock market, analyze data, chart and graph to make profit concept, businessman trader thinking while analyze green graph with fishing bait.
Stock index graph and chart in modern building background (blue bull chart)
stock exchange board background with financial data analysis graph
Illustration of business increasing graph backgound in blue & white.
Cityscape Growth: A vibrant cityscape backdrop with a dynamic stock market graph soaring upwards, representing financial success and upward trajectory.
growth chart
growth chart
Business man with logistics shiping business concept background.
Businessman hand touching of forex graph growth interface and financial data analysis. Stock market on blue background.
KPI key performance indicator business technology concept. Business executives use business news metrics to measure success against planned targets, Improving business process efficiency.
Double exposure of woman's hands making notes with forex graph hologram. Concept stock market analysis.
Finance, technology, and stock market trading are interlinked in this depiction, highlighting the concept and goals of financial success

Growth bar chart, Growing graph vector, Business chart with arrow, Profit growing icon, Growth success icon vector.
Blue glass bar and pie chart on tablet computer over white background, business or finance budget concept
Blue stock exchange market graph on LED screen for business analysis. Finance and economic graphs.
Gold Graph Arrow of Improvement. 3D Render Illustration.
Financial business statistics with bar graph and candlestick chart show stock market price
Stock market  trading graph candlestick chart suitable for financial investment concept, business chart and coins
Stock market trading graph candlestick chart suitable for financial investment concept, business chart and coins
A dynamic financial graph shows an upward trend with vibrant arrows indicating growth and success in market analysis.
financial chart with moving up arrow graph and glowing light on white color background
Stock market or forex trading graph in graphic concept suitable for financial investment or Economic trends business idea and all art work design. Abstract finance background
stock trader man smiling with financial graph report as background, Generative Ai
Creative business concept. Blue graph diagram or performance chart with rise and fall dynamic against blue background with copy space. Chart for marketing, annual or corporate report or profit growing
Finance and return on investment concept. Man touching on a virtual screen of data and charts, investments analysis in assets and financial growth graphs, business strategy analysis, and marketing.
Market forecast trend use chart and graphic
Silver bar, ingots and coins on financial  report. Growth of silver on stock market concept.
Silver bar, ingots and coins on financial report. Growth of silver on stock market concept.
Growing and declining graph
businessman hold graph chart, financial
Trustworthiness Icon Element For Design
Financial depressing and growth graph stock trading on bokeh background. Economic recession and recovery concept and return on investment roi idea
Double exposure of businessman using cell phone and stock market charts. Financial concept.
Close-up of a colorful business graph highlighting analytics and trends
Stock market or forex trading graph and candlestick chart suitable
Blue stock exchange market graph on LED screen for business analysis. Finance and economic graphs.
Business graph
Business graph


Why Wallsheaven is special?

30 Days on Returns

You can return or replace any product within 30 days without reason.

Free Express Delivery

Delivery is free for all of our products, wherever you are.

Eco Water-Based Inks

Our prints are odorless, ecological, and safe for children with vivid colors from natural dyes.

Simple Installation

Installing WallsHeaven's wallpaper mural is as easy as making paper airplane.

Artist Support

By choosing our photos, you will support the artists from all over the world.