


graph chart
Wall muralinfographic business illustration
Wall muralfinance concept company
Wall muralabstract statistic graphic
Wall muraltechnology growth datum
Wall muralinnovation plan information
Wall muralthree-dimensional visualisation strategy
Wall muralearning development price
Wall muralgraph
Wall muralchart
Wall muralinfographic
Wall muralbusiness
Wall muralillustration
Wall muralfinance
Wall muralconcept
Wall muralcompany
Wall muralabstract
Wall muralstatistic
Wall muralgraphic
Wall muraltechnology
Wall muralgrowth
Wall muraldatum
Wall muralinnovation
Wall muralplan
Wall muralinformation
Wall muralthree-dimensional
Wall muralvisualisation
Wall muralstrategy
Wall muralearning
Wall muraldevelopment
Wall muralprice
Wall muralrender
Wall muralfuture
Wall mural


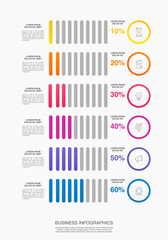
-or-infographic-indicator-with-pink:400:4:vnbyZXnsvGyPRlSMLWUW7BXjT6WwZDmL:224985967:as2.jpg)