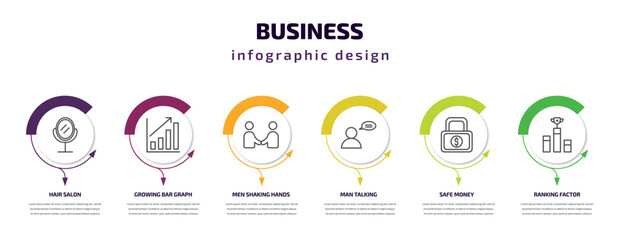


infographic graph
Wall muralchart bar business
Wall muralstatistic graphic design
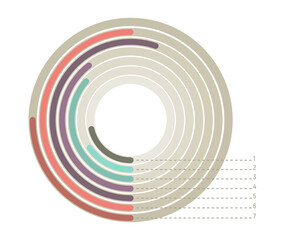
Wall muraldiagram vector datum
Wall muralelement report illustration
Wall muralpresentation template concept
Wall muralgrowth finance information
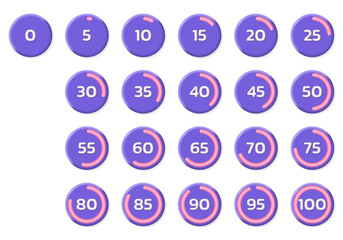
Wall muralline info set
Wall muralinfographic
Wall muralgraph
Wall muralchart
Wall muralbar
Wall muralbusiness
Wall muralstatistic
Wall muralgraphic
Wall muraldesign
Wall muraldiagram
Wall muralvector
Wall muraldatum
Wall muralelement
Wall muralreport
Wall muralillustration
Wall muralpresentation
Wall muraltemplate
Wall muralconcept
Wall muralgrowth
Wall muralfinance
Wall muralinformation
Wall muralline
Wall muralinfo
Wall muralset
Wall muralarrow
Wall muralmodern
Wall mural