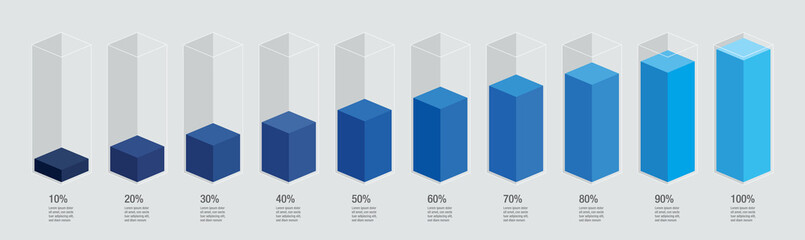


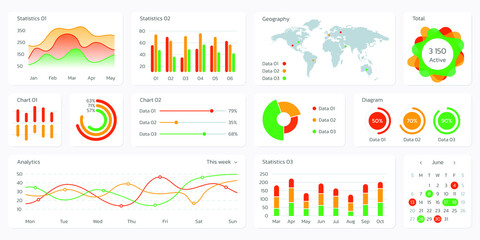


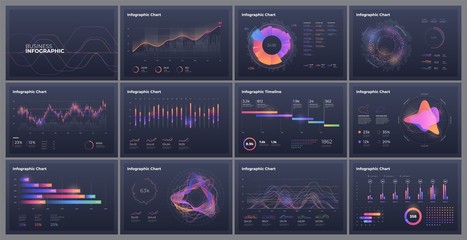


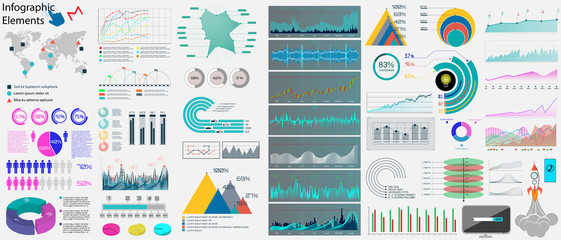


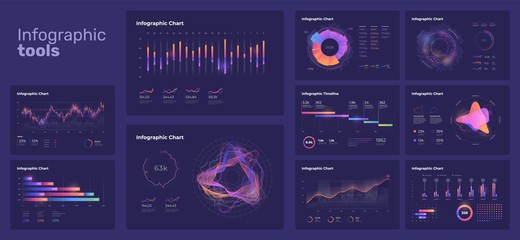


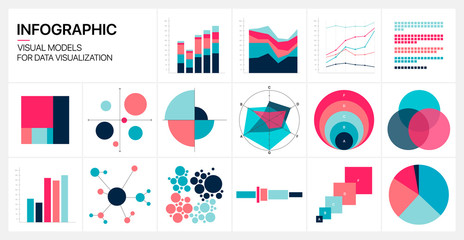


infographic chart
Wall muralgraph datum diagram
Wall muralstatistic graphic design
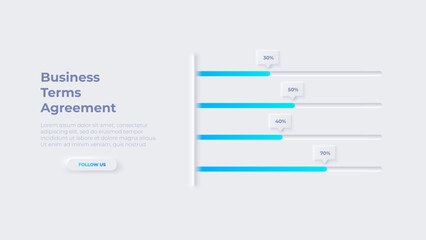
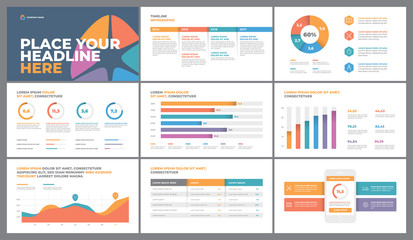
Wall muraltemplate presentation information
Wall muralconcept illustration report
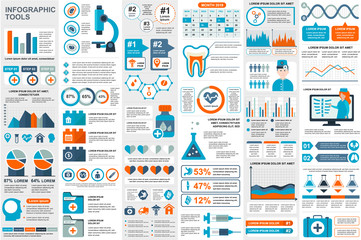
Wall muralicon info modern
Wall muralbackground web layout
Wall muralabstract growth set
Wall muralinfographic
Wall muralchart
Wall muralgraph
Wall muraldatum
Wall muraldiagram
Wall muralstatistic
Wall muralgraphic
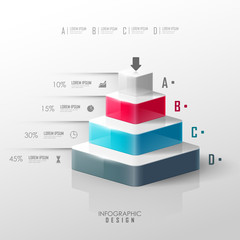
Wall muraldesign
Wall muraltemplate
Wall muralpresentation
Wall muralinformation
Wall muralconcept
Wall muralillustration
Wall muralreport
Wall muralicon
Wall muralinfo
Wall muralmodern
Wall muralbackground
Wall muralweb
Wall murallayout
Wall muralabstract
Wall muralgrowth
Wall muralset
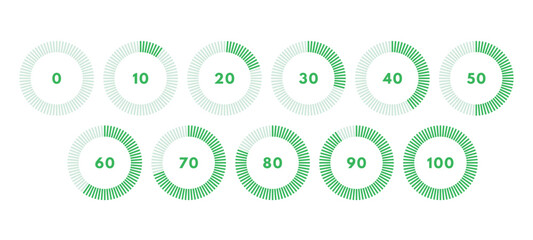
Wall muralsigns
Wall muralprogress
Wall mural


-from-0-to-100-ready-to-use-for-web-design,-user-interface-(ui)-or-infographic-indicator-with-red:400:2:5TbNJ7zSjI1qT33ALRngp9n9JyuLwBOr:241714253:as1.jpg)