



WallsHeaven makes decorative wall murals in high quality printing

83,093 Forex+diagram+management Wall Murals - Canvas Prints - Stickers

bar chart with line graph show stock market price or financial investment profit. business planning management background concept
A computer screen displays a multitude of colorful graphs and charts
Stock market data on digital LED display. Background stock chart.
Blue Stock Exchange Market trading graph on screen monitor for economic and financial investment. Business analysis chart display. Stock invest infomation.
Businessman and Hong Kong city view with blue bull chart on background. double exposure
Businessman plan graph growth increase of chart positive indicators in his business
Big data chart on city backdrop.Trade technology, and investment analysis.Business development, financial plan and strategy.
Trade and future concept
graph chart of stock market investment trading.
Business people at workplace, graphs
business finance technology and investment concept. Stock Market Investments Funds and Digital Assets. businessman analyzing forex trading graph financial data. Business finance background.
Dollar sign currency forex intraday options trading background. Stock market cryptocurrency bullion market analyzing trade motion graphic. Financial e-commerce wealth and money growth exchange bg.
A business man examines data on financial documents, company financial reports, graphics showing financial and numerical growth data. The concept of financial management to grow and be profitable.
Candle stick graph chart
Stock market or forex trading graph in graphic concept
Young businessman in online trading concept
Man with abstract forex chart
Market analyzing
Market analyzing
Stock exchange market concept, businessman hand trader press digital tablet with graphs analysis candle line on table in office, diagrams on screen.
forex trading graph and candlestick chart suitable for financial investment concept. Economy trends background for business idea and all art work design. Abstract finance background.
stock chart in monitor investment concept
A computer screen with many different colored graphs and numbers
Double exposure of finance graph , stationary and rows of coins for goal office , finance and business concept background and forex trading graph with economy trends business or finance background.
Trader holding in the hands a smart phone and researching stock market to proceed right investment solutions. Internet trading and wealth management concept. Hologram Forex chart over close up shot.
Composing with business building and stock chart
Businessman plan graph growth increase of chart positive indicators in his business
Blue Stock Exchange Market trading graph on screen monitor for economic and financial investment. Business analysis chart display. Stock invest infomation.
Stock market trading graph and candlestick chart for financial investment concept. Abstract finance background.
Stock exchange chart graph. Finance business background. Abstract stock market diagram candle bars trade.
Forex graph in modern city
Growing up of business finance technology and investment trading trader investor. Stock Market Investments Funds and Digital Assets. businessman analyzing forex trading graph financial marketing data.
Forex market growth and business investing concept with man finger on digital touch screen with trading diagram and graphs on dark background. generative ai
stock market background or forex trading chart abstract financial market chart
hand holding wireless peripheral with CAREER OPPORTUNITIES inscription, cyber business concept
Stock market or forex trading graph in graphic concept
Businessman running towards economic success
Stock market chart. Big Data. Business Graph. Investment graph. Abstract financial chart. 3D rendering.
abstract background of futuristic technology usa flag world maps and economy crisis down stock market graph
The 3d growth business graph on success financial represents profit and revenue growth, accompanied by a hovering arrow indicating positive market trends
Stock business finance technology and investment concept. Stock Market Investments Funds and Digital Assets. Businesswoman analysing forex trading graph financial data. Business finance background.
Word writing text Market Trade. Business photo showcasing forex trading graph of financial investment or Economic trends business
Stock market or forex trading graph in graphic concept suitable for financial investment or economic business idea design. Vector illustration
Double exposure of finance graph , stationary and rows of coins for goal office , finance and business concept background and forex trading graph with economy trends business or finance background.
Businessman using laptop with forex trading graph financial data. Goal business success strategy chart target and planning. Stock market, financial graph growth report, business development.
Composing with business building and stock chart (red bear chart on background )
Businessman plan graph growth and increase of chart positive indicators
Stock market graph and candlestick chart for financial investment concept.
Finance, global financial markets concept, world map at background stock market chart and forex data.
Stock market investment trading financial, stationary and rows of coins for goal office , finance and business concept background and forex trading graph with economy trends business
Pensive manager team, forex graphs
Finance concept
Finance concept
coins with trading graph, financial investment concept can be use as background
Shallow depth of field (selective focus) with details of a candlestick chart on a computer screen.
Glowing light bulb with charts on virtual screen.
Stock market or forex trading graph in graphic concept
Big graph of progress rate and analysis of global at forex strategy modern calculation for a company statistic. grow your investment structure with marketing measure report chart blue 3d illustration
graph of stock market trading market
Businessman writing charts.Business, technology, internet and technology concept
Economic graph with diagrams on the stock market, for business and financial concept
Charts graphs. Financial chart, stock analysis data for business background in digital screen. Graphics growth forex finance market. Trading candlestick chart, cryptocurrency digital economy.
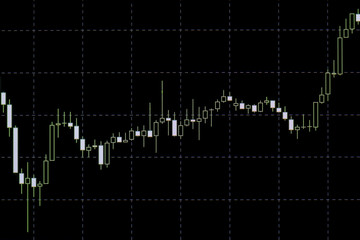
Red and Green Stock Chart or Forex Chart in Candlestick Styl on Black Background
Working business man, team of broker or traders talking about forex on multiple computer screens of stock market invest trading financial graph charts data analysis.
Financial growth concept with golden Bitcoins ladder on forex chart background. Virtual money.
A client in formal wear is signing the contract to invest money in stock market. Internet trading and wealth management concept. Forex and financial hologram chart over the desk.
Hong Kong Office buildings with graph index of stock Market ((blue bull chart)
Smartphone in hand and plan graph growth and increase of chart positive indicators
Forex concept : Candlestick chart red green in financial market for trading on black color background.
Stock trading, investment, candle stock market chart diagram website header banner city view skyline.
Coins on Stock market graph business forex trading and analysis investment indicator of financial board display double exposure money price stock chart exchange growth and digital
Stock market trading graph and candlestick chart for financial investment concept. Abstract finance background.
Fund management concept
Stack of money coin with trading graph, financial investment concept with blue filter can be use as background
Shallow depth of field (selective focus) with details of a candlestick chart on a computer screen.
Analysis profitability of working companies with digital augmented reality graphics, positive indicators in 2023, women calculates financial data for long term investments
Stock market or forex trading graph in graphic double exposure concept
Digital currency and stock market chart. 3d rendering toned image double exposure
Business deal by call concept with businessman talking to cell phone at digital screen background with financial chart diagram and graphs
hand holding wireless peripheral with BEST PRACTICE inscription, cyber business concept
Financial data on a monitor which including of Market Analyze. Bar graphs, Diagrams, financial figures. Abstract glowing forex chart interface wallpaper. Investment, trade, stock, finance
Stock exchange market graph on LED screen for business concept.
Hand touching graphs of financial indicator and analysis chart
Bear bull with chart bar logo design. finance vector logo design
Business investment finance analysis data statistics digital stock market exchange forex trading graph chart financial candlestick indicator screen board abstract graphic design background. 3d render.
Businessman with laptop in city, charts
Hong Kong Office buildings with graph index of stock Market ((red bear chart)
Businessman plan graph growth and increase of chart positive indicators
Business analysis diagram. Finance background data graph
Financial stock trading graph chart diagram business finance concept double exposure mixed media.
Hong Kong Office buildings with graph index of stock Market ((blue bull chart)
Stock market or forex trading graph in graphic concept suitable for financial investment or Economic trends business idea and all art work design. Abstract finance background
Stock index growth shown the graph and chart in Commercial buildings background (blue bull chart)
Composing with business building and stock chart (blue bull chart  on background
Composing with business building and stock chart (blue bull chart on background
Composing with business building and stock chart (red bear chart on background )
Businessman and Hong Kong city view with blue bull chart on background. double exposure
Trade and teamwork concept
Stock market trading graph and candlestick chart for financial investment concept. Abstract finance background.
Businessman plan graph growth  increase of chart positive indicators in his business
Businessman plan graph growth increase of chart positive indicators in his business
Stock exchange market graph. Finance, exconomic, business concept.
Business investment finance analysis data statistics digital stock market exchange forex trading graph chart financial candlestick indicator screen board abstract graphic design background. 3d render.
Businessman plan graph growth and increase of chart


Why Wallsheaven is special?

30 Days on Returns

You can return or replace any product within 30 days without reason.

Free Express Delivery

Delivery is free for all of our products, wherever you are.

Eco Water-Based Inks

Our prints are odorless, ecological, and safe for children with vivid colors from natural dyes.

Simple Installation

Installing WallsHeaven's wallpaper mural is as easy as making paper airplane.

Artist Support

By choosing our photos, you will support the artists from all over the world.