WallsHeaven makes decorative wall murals in high quality printing

51,154 Finance 2 Chart Wall Murals - Canvas Prints - Stickers

Two businesswomen pointing at financial charts and graphs on a report with a pen while working late in the office
Two businesswomen collaborating in an office meeting, analyzing financial documents and strategizing for success
Black woman in an office using two monitors to display data and graphs.
Two colleagues working on a laptop with financial charts overlayed, in a modern office setting.
A vector illustration of a line graph with two intersecting lines, set against a grid background.
A magnifying glass over two graphs with data and charts on them.
Futuristic business partnership concept. Abstract digital handshake with two hands formed by lines, dots, and geometric shapes on a blue tech background, symbolizing connectivity and teamwork
Young business people company employees man and woman having discussion analyzing company accounting on meeting looking to financial data on pc computer screen with charts oat the desk.
Two rectangular blocks on orange background
Two Business Professional Discussing Planning and Analysis with Charts and Graphs in a Modern Office Setting
Two wheat plants beside financial graphs, symbolizing the intersection of agriculture and economics, ideal for agricultural investors.
Icons in two colors about investment. Financial concept.
A colorful pie chart is held in two hands, symbolizing data representation and analysis in a business or educational context.
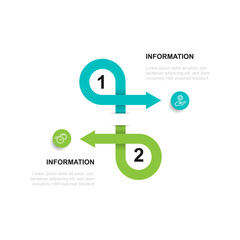
Modern template infographic vector element with 2 step process suitable for web presentation and business information
Business Analysis with Charts and Laptop in Office
Contemporary art collage. Two people push red cubes trying to achieve success, while man with experience rolls circle trying to develop. Concept of business development, career growth, success. Ad
Two professionals analyzing business data on a screen, discussing financial graphs and charts in a modern office environment.
Two businesspeople shake hands in front of a large screen displaying financial data.
A man is sitting at a desk with two computer monitors in front of him
red arrow business graph going down represent loss 2
Two people standing in front of a large screen with a graph on it
Two-stage business infographics with icons, can be used for presentations or website
"A professional illustration showing an investor managing their portfolio with a focus on two types of charts. On one side is a pie chart displaying the allocation of assets within the portfolio,
Stock exchange market traders investors working on financial trading charts analysis Two happy busy business men analysts consulting on digital finance forecast using laptop in office  : Generative AI
Stock exchange market traders investors working on financial trading charts analysis Two happy busy business men analysts consulting on digital finance forecast using laptop in office : Generative AI
Business partners discussing financial reports at meeting. Two business partners review financial documents, discussing performance charts and graphs during an office meeting.
The image shows two people making a financial transaction: one is handing cash to the other, who is holding a notebook and pen. In the background is a pie chart with financial symbols,
Closeup of a businessman's hand analyzing financial charts.
Flat design of financial charts and graphs on a digital tablet, cartoon flat design, long shot.
Abstract minimalistic business chart with rising bars on a vibrant orange background, accompanied by two pens, ideal for finance or data concepts.
Strategic Analysis:  A close-up view of two business professionals diligently reviewing financial documents, highlighting their focus and dedication to achieving success. The warm lighting and blurred
Strategic Analysis: A close-up view of two business professionals diligently reviewing financial documents, highlighting their focus and dedication to achieving success. The warm lighting and blurred
Modern infographic template. Creative circle element design with marketing icons. Business concept with 2 options
Finger Pointing at Digital Growth Chart 2
Close-up view of two stacks of coins placed on a financial document with charts and graphs in the background.
Business template infographic vector element with 2 step or option
Business team meeting working with new startup project, discussion and analysis data the charts and graphs. Digital tablet, calculator, laptop computer using, Business finance and accounting concept.
Two businesswomen analyzing financial graphs and charts at work
Financial data and charts. Dolly in. Loop able. Blue-Cyan. 2 videos in 1 file. Financial data and charts showing increasing profits. More color options in my portfolio
A man sits at a desk in a home office, analyzing data on two computer screens
Stock profit power manipulation background image.Businessman control stock market direction to get profit by pick up the growth arrow symbol with chart and graph by his two hands. Hope, Prosperity,
Two businessmen shake hands in front of a stock market chart, symbolizing a successful business deal.
Two women engaged in a business meeting, discussing documents and charts in a modern office environment.
Data-Driven Decisions: A close-up of a business meeting, two hands point to graphs and charts, symbolizing the collaborative process of analyzing data and making informed decisions.
"A professional illustration showing an investor managing their portfolio with a focus on two types of charts. On one side is a pie chart displaying the allocation of assets within the portfolio,
Marketer or analityc manager team dressed in suits working with paper charts and laptops at the white office interior
Business Analysis: Close-up of two hands pointing at financial data on a clipboard, showcasing the collaborative nature of financial analysis and the importance of data-driven decision making.
A magnifying glass over two graphs with data and charts on them.
Two professionals discussing financial graphs and charts on a laptop during a meeting.
Two men standing in front of a large screen with red lines on it
Stacked coins, white paper with bar charts, and two pens on blue background representing financial analysis and business growth.
Two miniature businessmen shake hands over a financial report.
Set of circular chart diagrams. Circles arrow cut separated on1,2,3, 4,5, 6, with empty middle,simple flat design vector illustration.
Two businessmen analyzing charts with fluctuating data, showing financial crisis or market volatility concept in vector illustration.
Close-up of two hands shaking in a business agreement, blurred financial chart background.
Two businesswomen are working late in a modern office, discussing financial documents and analyzing charts
Rolling dice on stock trading charts and getting one one
Two businesswomen analyzing financial charts and data on desk
Bitcoin and Ethereum, two leading cryptocurrencies, displayed on a computer screen with fluctuating price charts, symbolizing digital currency market volatility.
chart showing balances moving upwards with arrows and lights with a blue, white and black color scheme. digital photogaphy --ar 2:1 --style raw --v 6 Job ID: adb232ea-8d17-42b4-84d5-ccfc96ddaaf5
Two businessmen in suits shake hands in front of a large screen displaying stock market data.
2 percent people icon vector graphic, Human pie chart, Man pictogram concept, 2/100. Vector Male Icon and 2% Symbol
Two business professionals shaking hands in a modern office setting with financial charts and a laptop on the desk.
Vector infographic thin line design with marketing icons. Business concept with 2 options, steps or processes.
Two pens are lying on colorful financial charts showing growth potential
Create a detailed vector illustration of an area chart with shaded regions, featuring two lines, one orange and one blue.
Strategic Collaboration: Two businesswomen meticulously analyze colorful financial charts and graphs, showcasing focused teamwork and data-driven decision-making.
Business team meeting working with new startup project, discussion and analysis data the charts and graphs. Digital tablet, calculator, laptop computer using, Business finance and accounting concept.
Close-up of two gold bars on a wooden surface with financial stock market chart background, shining in warm light.
Two men standing in front of a red chart with a downward trend
Two hands analyzing financial graphs and charts with a cup of coffee. Business data analysis concept with charts, graphs, and notes.
A 3D pie chart with 4 slices in pastel colors. The chart is on a white background and takes up 2/3 of the space.
3D Cartoon Businessman Shocked Holding Two Charts Showing Decline and Rise
Two businesswomen discussing financial charts in an office, using a calculator and whiteboard for strategy and teamwork. Professional and focused on growth
white finance text bar graph two pie chart pink background. High quality
Two businesspeople sitting at a desk, surrounded by data charts and graphs on a laptop screen, discussing financial data.
Two professionals discuss insights from data charts while collaborating in a contemporary office environment
2 step line square connected with icons suitable for infographic template
Two professionals analyze business data using laptop displaying sales dashboard and various printed charts on desk.
Two hands exchange a document against a backdrop of financial charts and buildings, suggesting business, finance, or investment themes.
Two young businesswomen are working late in the office, collaborating on a project and smiling while analyzing financial charts and business data
UK economic crisis. United Kingdom flag or Forex for analyzing profit finance business trend data (2)
円安イメージ2
円安イメージ2
Minimalist sketch of a growth chart with two pens on a wooden surface, ideal for business and financial concepts.
Two female business professionals reviewing data in modern office with cityscape views, charts graphs are displayed on screen, analysis, strategy, collaborative corporate environment.
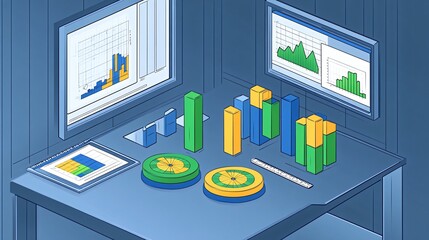
A vector background featuring a calculator and two bar graphs with a blue background.
Business professionals analyzing financial charts and graphs on a wooden table, collaborating on data-driven strategies for growth.
A close-up shot of two businesspeople shaking hands over a desk with financial charts and documents spread out on the table symbolizing a successful agreement or partnership between them
Two female entrepreneurs collaborate in the workplace, examining financial graphs and using a calculator to plan investment tactics
Business handshake between two individuals in a corporate setting with financial charts on a monitor in the background.
Two hands holding charts and graphs on paper over teal background, displaying various business data analysis and statistical information.
Modern infographic template. Creative circle element design with marketing icons. Business concept with 2 options
A desk with 3 computer monitors, 2 tablets, and 3D charts showing data analysis.
Business success people - Businesspeople, man and woman standing with laptop computers in front of rising chart and graph with green rising arrow. Flat design vector illustration with white background
Business creative infographic process chart. Vector layout design with marketing icons and 2 steps or options.
Two businesswomen are observing a glowing unicorn on a wall of screens displaying financial data
Two business partners collaborating and analyzing financial reports and data charts together at a desk in the office discussing strategy and decision making for their company or startup
Professional analyzing data on two monitors in a modern office environment.
Two professional analyzing financial data graphs, charts on laptop display at a modern workspace. Financial analysis or business evaluation concept
A businessman and two Asian female accountants discuss presenting a new project idea. Analyze financial and investment market planning and statistics at the office.


Why Wallsheaven is special?

30 Days on Returns

You can return or replace any product within 30 days without reason.

Free Express Delivery

Delivery is free for all of our products, wherever you are.

Eco Water-Based Inks

Our prints are odorless, ecological, and safe for children with vivid colors from natural dyes.

Simple Installation

Installing WallsHeaven's wallpaper mural is as easy as making paper airplane.

Artist Support

By choosing our photos, you will support the artists from all over the world.