


WallsHeaven makes decorative wall murals in high quality printing

2,637,348 Finance%2Bstock%2Bsuccess Wall Murals - Canvas Prints - Stickers

Diligent Analysts Shape Private Equity Market Outlooks growth private analyzing
Orange And Blue Bar Graph On Financial Charts
 The concept of investment in an investment fund. AI generative.
The concept of investment in an investment fund. AI generative.
Indian financial stock exchange, stock market. 3d illustration ..
stock market chart
stock market chart
A graph with orange lines and a blue background
Golden Bitcoin coin on a stack of coins against a stock market graph background.
magnifying glass scan for great stock, analysis of financial concept
Background illustration of future business and finance
Top view of smart business people brainstorm marketing idea at meeting table while compare stock market investment data between laptop and tablet. Business team planning financial plan. Directorate.
Concept of business audit stock financial finance management on analysis data , close up of statistic graphs and magnifying glass on table
Growth arrow gold coin currency price on money business finance 3d background with success financial market investment earning graph or economy concept cash profit chart and increase stock up symbol.
A bull wearing a suit sitting on a chair using the tablet for trade stock
Glowing stock market numbers on digital displays with a blurred cityscape background, highlighting the fast-paced nature of finance
Growth arrow up and progress success business skill increase improvement graph on market profit stock background with goal of achievement futuristic finance economy. Generative Ai
back of businessman in suit with business office glass modern buildings background for economic market stock investment, financial freedom portfolio or company profit and strategy growth IPO banner
A vibrant stock market display with fluctuating numbers in red, green, and yellow, representing financial trends and investment opportunities.
Bill And Payment line web icons. Money and Coins. Cash, Credit Cards, Money Bag, Containing banking, Investment, income, accounting, money, Finance. Editable stroke.
Gold bars and coins on the background of the stock exchange. Financial concept.
Futuristic technology concept. Team of artificial intelligence software engineers and finance workers in financial stock market that is digitalized with graphics into digital twin of finance Industry
AI predicting stock market trends, finance technology, investment insights
A tower of coins arranged on financial paper, set against a backdrop of a stock market graph, symbolizing investment growth and economic trends.
The hand points to the up arrow on the stock market chart, symbolizing growth and business success
Man in suit anxiously watching stock market data.
Close-up of a green financial stock market graph showing fluctuating data on a dark background, representing market analysis and trading.
stock market chart
stock market chart
Dynamic stock market graph showing rising and falling trends in financial data, ideal for financial analysis and investment.
Magnifying glass focuses on a stock market graph on a glowing digital screen.
Smart trader businessman concentrating on dynamic stock exchange investment on pc and laptop showing on screen with high profit in searching market at neon light office in dark room night. Surmise.
Red taxes stamp on financial document with stock market graphs
Stack of coins and paper currency accompanied by a rising graph of stock market trading indicators, symbolizing financial growth, investment profits, and the dynamic nature of the global economy
Abstract polygonal magnifying glass search money Investment or financial analysis, Searching for investment opportunities, stock market research. Dark blue Futuristic low poly and Technological.
A businessman in suit touching glowing upward graph chart on dark background showing business growth and success
investing in dividend stocks or cryptocurrency for financial freedom concept illustration
Gold coins scattered over stock market newspaper, lens flare effect, gold coin, market, financial news
stock market graph on red , falling of stocks
A stock market board with many numbers and percentages
Bar charts with green color going up and down for positive Eco-investing stock market or green investment banking charts
Interest rate and dividend concept businessman calculating income and return on investment, save, income, return, retirement, compensation fund, investment, dividend tax, stock market, saving, trade
A businessman indicating growth in financial success with a metaverse technology chart on a stock market analysis background reflecting digital economy investments
Forex stock market trading finance chart
Stock plunge index chart. Economic crisis and stock market. High quality AI generated image
The stock market chart is on the background of golden coins and a digital cryptocurrency coin.
Startup founder negotiating investor term sheets, negotiation terms, funding agreement
Businessman using laptop computer to analyze stock graphs and investment finance and stock market and banking.
Financial chartsprofit graphs showing business stock market trends analyzed using candlestick graphs against a dark blue backdrop
Graph, chart and hologram of stock market, financial management and investment profit.
AI financial analysis, holographic stock market visualization, digital financial hub
Financial analyst, pointing at real estate growth chart, market potential, Watercolor style
Investment risk with dice illustration
Bluechip stock investment, focusing on stable companies
Upward trending graph with arrow showing business growth representing algorithmic trading, financial success, market improvement, stock increase
Close-up of a digital stock market chart showing trends with colorful graphs and data visualization. Ideal for finance and business contexts.
Man hand with flat phone on palm, stock market graph of going upwards from phone with rocket. on a gradient background of black and blue with copy space area generative ai
Letters ETF on stock finance or trading chart analysis, exchange-traded funds background
 The chessboard becomes a market battleground, set against a backdrop of stock graphs, each move a financial gambit
The chessboard becomes a market battleground, set against a backdrop of stock graphs, each move a financial gambit
red line sharply dips downward on a stock market chart, symbolizing a market downturn, economic decline, or loss in investments. The image reflects volatility and financial uncertainty
A detailed view of a computer screen with gold stock market indicators. investment finance
World business graph or chart stock market or forex trading graph in graphic concept suitable for financial investment or Economic trends business
Forex stock market trading finance chart
business graph with arrow
Growth money business increase finance profit on 3d investment background with coin stock wealth arrow graph. Financial economy concept rise gold strategy cash currency. Success market economic budget
Business analyst examining financial data and stock market trends on blue graphs and charts
Green Arrow Upward Trend on Blue Digital Display, financial growth, stock market, investment, economy,
Analyzing results, an accountant, businessman or financial expert analyzes results. Calculates results from graphs, business reports and financial charts. Company stock market.
A seedling is growing on a coin lying on the ground. Green investment concept, increasing money to invest. Digital financial growth concept with green curve chart stock market yield on the background
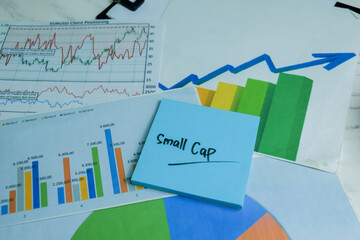
Concept of Small Cap write on sticky notes isolated on Wooden Table.
Finance business background. Stock crash market exchange loss trading graph analysis investment indicator business graph charts of financial digital background.
Red stock market or forex trading chart, abstract finance background. Concept of financial crisis, recession, stock market crash, bear market, and economic downturn.
The boy is looking at the progress of the graph.
Stock market icon collection. Related to stocks, stock exchange, financial goal, shares, investment, bull market, bear market and investment icons.
Closeup financial chart with uptrend line candlestick graph in stock market on blue color monitor background
Financial graph with up trend line candlestick chart in stock market on neon color Widescreen background
Abstract financial stock market graph with glowing lines and trend data analysis. Ideal for business, investment, and finance concepts.
A graph depicting predictive analytics for demand forecasting in the energy sector. Generative AI.
Close-up abstract image of a stock market graph on a screen with red and green lines.
Financial growth technology digital data, stock market business and exchange financial growth
The Growth of Financial Coins
Coin stack growth chart with increasing arrow. Finance, capital and money increase concept. 3d vector icon. Cartoon minimal style.
Stock market analysis, finance and investment concept. Business team analyzing financial graph growth trading, data analysis, business strategy and solution, stock market report, currency exchange
Blurred bokeh effect with captivating stock market charts and stunning banking related imagery
a?'imagine: Global stock market technology abstract background, dynamic light trails representing worldwide financial data flow.
Stacks of gold coins on a digital chart background representing finance and investment growth in modern economics.
A piggy bank sits on a desk. The piggy bank is wearing glasses and there are pencils and a notebook on the desk. The background is blurry.
Computer monitor showing an abstract network monitoring dashboard with real-time data analytics, graphs, and system health indicators, framed in an editorial photography style
Focused professional analyzing financial data on dual monitors. financial expert in modern office setup. business analytics and stock market analysis at work. AI
Stock market trading finance investment chart and chart in smartphone app Stock market or stock mark
Golden money coin stack on black background. Symbolizing wealth, success, and financial growth. Financial background concept.
Financial analysis stock market indicator chart wealth candlestick finance data graph investment exchange business concept on 3d background of growth digital money trade profit global economic price.
The spreadsheet of finance calculation
Forex Candles - Price Changind Chart
Coins
Coins
stock chart break ceiling
Business success growth chart
Rows of coins with finance graph and stock display double exposure concept


Why Wallsheaven is special?

30 Days on Returns

You can return or replace any product within 30 days without reason.

Free Express Delivery

Delivery is free for all of our products, wherever you are.

Eco Water-Based Inks

Our prints are odorless, ecological, and safe for children with vivid colors from natural dyes.

Simple Installation

Installing WallsHeaven's wallpaper mural is as easy as making paper airplane.

Artist Support

By choosing our photos, you will support the artists from all over the world.