WallsHeaven makes decorative wall murals in high quality printing

2,637,502 Finance%2Bstock%2Bsuccess Wall Murals - Canvas Prints - Stickers

Trading graph,business graph,financial investment and growth concept
Growth and invest concept
Stock market graph analysis. Stock market data on LED display on laptop screen for finance and economic. Business graph background.
3d rendering of  stock exchange display panel
3d rendering of stock exchange display panel
Businessman with chart in the fall, economy going down.
Office interior with graphs and diagrams
Widescreen Abstract financial graph with uptrend line arrow and bar chart of stock market on blue color background
Stock market. Candle stick graph chart of stock market investment trading. Bullish point, down trend of graph. Bear Market. red background. Vector.
Blue stock exchange market graph on LED screen for business analysis. Finance and economic graphs.
computer screen with trading chart or stock market
financial, finance, investment, chart, graph, invest, interface, indicator, rising, stock. drawing line to calculation indicator chart and graph is tools of investment. financial finance stock.
A focused businessman or stock broker analyzes stock market charts and trends on a laptop making strategic decisions for financial success. Ai generated
Financial Price Quotes
Investor and trader make decision
stock market graph
stock market graph
Investment Money Capital Market Vector Line Icons Set
graph, technology, business, illustration, digital market
Chart of business data graph diagram and growth financial graphic report information on futuristic finance background with stock market economy infographic template.
Increase profits, vector  icon money. White background.
Increase profits, vector icon money. White background.
Investments and finance
Trade and stock concept
Holding coins graph stock market
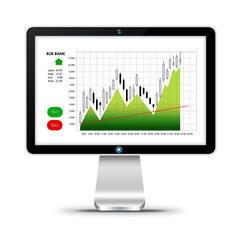
computer with stock market chart isolated over white
Stressed trader touching head when looking at computer screens with stock market data
a modern monitor with graphics and forex charts on the screen. money, business. Generative AI
Stock market graph up trend, growth and success
Stock market graph
Stock market graph
South Korea Stock Exchange market crisis red market price down chart fall Business and finance money crisis red negative drop in sales economic fall
Golden coils in soil with young plants
Financial accounting
digital financial chart candlestick graph in stock market
Stock price movement chart with red and green Japanese candlesticks on a black background. Can be used to overlay on the screen. Stock chart. A close-up chart of cryptocurrencies
Business stock market background
Financial accounting stock market graphs
3D digital economy positive trend concept. Finance business idea increase profits marketing. Investment control hand pen drawing graphic vector illustration
Finance trade manager analyzing stock market, financial data and charts.
Double Exposure Image of Business and Finance - Businessman with report chart up forward to financial profit growth of stock market investment.
Double exposure of forex chart over coffee cup background in office. Concept of financial analysis and success.
Businessman working in financial graphs in screen.
Financial trade concept. Stock market and exchange. Candle stick graph chart.
Businessman hand pointing finger to growth success finance business chart of metaverse technology financial graph investment diagram on analysis stock
colorful stock market charts with bars and lines. Finance, investment, and success concept
magnifying glass magnifying glass lies on the table for Analytical research in economics, study of financial data
Falling stock market chart on dark background against the backdrop of stock quotes
Recession of stock market
Financial investment concept, Double exposure of city night and stack of coins for finance investor, Forex trading candlestick chart, Cryptocurrency  Digital economy. economy growing.
Financial investment concept, Double exposure of city night and stack of coins for finance investor, Forex trading candlestick chart, Cryptocurrency Digital economy. economy growing.
Business stock finance marketing competition index variety of rice in supermarket sale growth shown by graph and chart with data analysis background.
Business analysis, finance and investment. Businessman using digital tablet with financial graph growth and stock market chart, analyzing business data to increase sales and revenue profit
the questionnaire
the questionnaire
ETF Exchange-traded fund stock market business finance investment concept.
A bull with wireframe on a line going up and stock market background. Concepts of exchange and stock market with symbol of digital coin.
New york stock exchange analysis forex indicator Trading graph chart business growth finance money crisis economy, AI
Inflation and economic crisis. Small shopping cart with Stacked coins and growth graph. cost rising concept. Shopping cart and red arrow pointing up. Stack of coins with shopping carts
This ist the Eco Way
Financial stock market infographics, financial information
stock market chart vector illustration background
finance growth illustration set. characters invested money in stock markets. stock business concept. vector illustration.
vector banner with arrows of different sizes. flat image of moving forward arrows on dark background. vector illustration, eps 10.
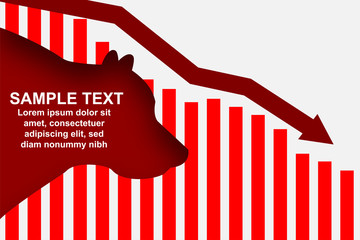
stock market fall with bear vector
Data analysis, Financial growth and economy, Finance Hand, Cost optimisation, business optimisation, optimisation Vector Icon Design- Editable Stroke
Coins, charts or stock market with trading, hologram or overlay for financial investment graphs. Background, money increase or inflation with finance, profit growth or economy info with stocks value
The illustration is a dynamic graph showcasing an array of data points with trend lines. The graph represents the trends and fluctuations of a specific metric over a period of time. Generative AI
Money gold coin 3d finance price arrow concept profit isolated on business currency financial background with growth investment banking economy cash or success market graph chart exchange dollar icon.
Investment Strategies Isometric Outline Illustration
Magnifying glass and documents with analytics data lying on tabl
financial portfolio review
3D Rendering of Red stock market graph dropping down dramatically Global Stock market chart panic sell concept. Extreme bearish stage. For stock, cryptocurrency, financial news background
Investment and trading concept with business chart and cityscape background.
Financial data of stock market in term of a digital prices on LED display. A number of daily market price and quotation of prices chart to represent candle stick tracking in Forex trading.
double exposure of city with row of coin stack with growth stock chart and graph progress report for business investment finance banking and money saving concept.
Virtual stock market lines and financial charts over dark background. Digital screen. Concept of finance advisory and international consulting. Huds, numbers and line graphs
Abstract neon background with light lines and rays. Neon geometric shapes. Symmetric reflection. Empty dark scene.
stock market finance graph background with abstract Growth graph chart. 2d illustration.
Creative forex chart backdrop
Business success with stock graph and light bulb
Increasing columns of coins, step of stacks coin on dark background with copy space for business and financial concept.
investment stock market data analysis concept, businessman using smartphone analyst virtual trading graph, trading online, financial mobile application platform. Generative ai
stock market graph
stock market graph
Blurred financial chart with candlestick graph in stock market, uptrend line and bar monitor with magnifying glass
Growth arrow target direction concept to success.
Stocks fall. Candle stick graph chart of stock market investment trading. Bullish point, down trend of graph. Futuristic red signal trend drop down arrow chart.
Growth strategy business graph analysis concept on finance chart data diagram 3d background of digital financial technology stock market or investment trade report and success profit money management.
Green candles show rapid investment growth in the markets.
Market share, financial concept. Art collage.
stock market finance graph background with abstract Growth graph chart. 2d illustration.
Trade and finance concept
Growth stock diagram financial graph or business investment market trade exchange analysis chart and economy finance report, AI Generative
Financial data document graph chart report statistic marketing research development  planning management strategy analysis accounting. Financial business technology hologram concept. 3d rendering.
Financial data document graph chart report statistic marketing research development planning management strategy analysis accounting. Financial business technology hologram concept. 3d rendering.
Stock market boom, financial gains, safe investment concept. Green arrow soaring over financial figures. Digital 3D render.
Businesswoman in stock trading concept
stock market
stock market
Glowing candlestick forex chart on blurry bokeh background. Technology, trade and financial data concept. 3D Rendering.
stockCity
stockCity
writing a check , making payments


Why Wallsheaven is special?

30 Days on Returns

You can return or replace any product within 30 days without reason.

Free Express Delivery

Delivery is free for all of our products, wherever you are.

Eco Water-Based Inks

Our prints are odorless, ecological, and safe for children with vivid colors from natural dyes.

Simple Installation

Installing WallsHeaven's wallpaper mural is as easy as making paper airplane.

Artist Support

By choosing our photos, you will support the artists from all over the world.