


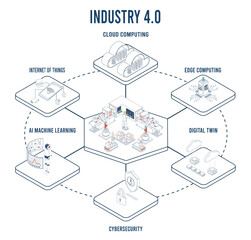


technology diagram
Wall muralsymbol business concept
Wall muraldatum icon chart
Wall muralillustration graph vector
Wall muralinformation connection graphic
Wall muralinfographic digital cyberspace
Wall muralsigns finance element
Wall muralnetwork computer line
Wall muraltechnology
Wall muraldiagram
Wall muralsymbol
Wall muralbusiness
Wall muralconcept
Wall muraldatum
Wall muralicon
Wall muralchart
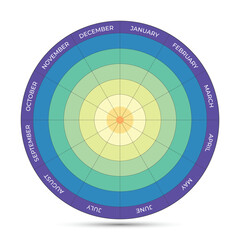
Wall muralillustration
Wall muralgraph
Wall muralvector
Wall muralinformation
Wall muralconnection
Wall muralgraphic
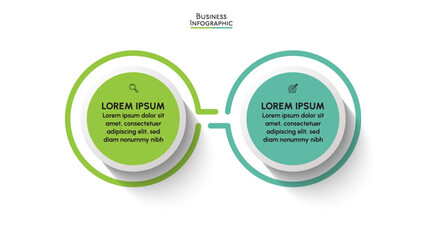
Wall muralinfographic
Wall muraldigital
Wall muralcyberspace
Wall muralsigns
Wall muralfinance
Wall muralelement
Wall muralnetwork
Wall muralcomputer
Wall muralline
Wall muralmanagement
Wall muralstrategy
Wall mural


