

WallsHeaven makes decorative wall murals in high quality printing

91,941 Diagram+economic+indicator Wall Murals - Canvas Prints - Stickers

Graph on rows of coins. Financial stock trading graph chart diagram. Exchange and Trading concept.
Group of business people brainstorming business challenges.
Businessman with phone in hands, graph lines and candlesticks with skyscrapers
Stock market digital graph chart on LED display concept. A large display of daily stock market price and quotation. Indicator financial with buildings background
Graph Icon in trendy flat style isolated on white background.
Stock market or forex trading graph concept
miniature people. figure of a businessman with a graphic indicator of sales growth and income of business production. building
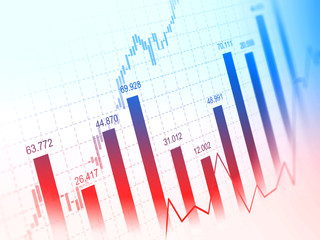
Image of blue economic graph and stock market data
Fiscal set. Creative icons: financial economic, fluctuation, self investing, payment method, increased profit, global economy, capital, commodity, consumption, interest rate.
Analyzing a business analytics, Business Intelligence, Key Performance Indicators on a digital screen interface in hand of businessman.
rising percentage signs in blocks, symbolizing inflation and economic growth
investment, graph, cryptocurrency, bitcoin, indicator, hand, investing, trader, risk, diagrams. hold smartphone via fingertips. then upper that's trend chart of investment cryptocurrency showing
Low angle view of Stock market graph with volume indicator and blurred modern building with blue sky clouds, stock market and financial concept
Hand touching a graphs of financial indicator  accounting market economy analysis chart
Hand touching a graphs of financial indicator accounting market economy analysis chart
Businessplan graph growth and increase of chart positive indicators in his business
Forex graph business or Stock graph chart market exchange ,Technical price candlestick with indicator on chart computer screen background, Stock trading graphic design for financial investment trade
Multi exposure of virtual abstract financial diagram on a modern furnished office interior background, banking and accounting concept
Businesswomen analyze opportunity investment with a digital candlestick chart and virtual bar chart, market rise business market growth 2024, trend line increase profits, financial concepts
Accounting
Accounting
financial stock market graph chart of stock market investment trading screen
 Stock diagram on the screen
Stock diagram on the screen
Business Man using a digital tablet with a business graph showing up on a virtual screen. Business growth and strategy, Stock market indicator concept.
Forex graph lines and bars with rising candlesticks and lines
Double exposure Candle stick graph chart with indicator coin stacked on technology financial graph background. Finance and investment concept.
Close up Green and red Candle graph on digital screen. Concept for financial and stock graph.
Stock market or forex trading graph in graphic concept
miniature people. figure of a businessman with a graphic indicator of sales growth and income of business production. building
Image of blue economic graph and stock market data
Stock market investment trading technical analysis candlestick chart on black background. Business candle stick graph exchange trend. Trader financial investment index concept vector illustration
Stock Market Concepts With Skyscrapers. Abstract modern city.
rising percentage signs in blocks, symbolizing inflation and economic growth
Close-up of a financial trading screen displaying market data with various colored candlestick charts, numerical values, and trend lines indicating stock performance.
Business man analyzing stock graph chart by fibonacci indicator, stock markets analysis by chart indicator concept
securities price chart on the monitor screen
Strategy, investment, business planning chart with indicator
Technical price candlestick with indicator on chart computer screen background, Stock trading graphic design for financial investment trade, Forex graph business or Stock graph chart market exchange
Double exposure of virtual creative financial diagram on US flag and blue sky background, banking and accounting concept
Businessman in Hand touching graphs of financial indicator and accounting market economy analysis chart
Financial charts for development economic growth, planning, goal achievement, perspective
3d Render of globe. African and European continent. Connecting lines and dots.
Stock Market fluctuation
A 2d illustration of a graph with bars, lines, and dots showing some data and trends
Man finger touch graph lines and bars with numbers
Double exposure Candle stick graph chart with indicator coin stacked on technology financial graph background. Finance and investment concept.
Close up Green and red Candle graph on digital screen. Concept for financial and stock graph.
Stock market or forex trading graph in graphic concept
planning analyze indicator and strategy buy and sell, Stock market, Business growth, progress or success concept. Businessman or trader is pointing a growing virtual hologram stock, invest in trading
Investment and trading concept with business chart and cityscape background.
Hand touching a graphs of financial indicator accounting market economy analysis chart
Businessman using smart phone with virtual business icons to improve success goals target
Businessman use laptop analysis graph for trade stock market on the screen Businessman hands use laptop check chart stock growth. Hand male stock graph chart point target success
stock market investment graph on financial numbers abstract background.3d illustration
Forex and stock market chart hologram over panorama city view of Bangkok, the financial center in Southeast Asia. The concept of international trading. Double exposure.
securities price chart on the monitor screen
a graph on a screen
a graph on a screen
Stock exchange market or forex trading graph analysis investment indicator
Multi exposure of virtual abstract financial diagram on a modern furnished office interior background, banking and accounting concept
finance bar graph with market volatility
Economic graph with diagrams on the stock market, for business and financial concepts
Illustration of candlestick chart
Businessman virtual screen graph stock market indicator currency exchange financial management forex. business profit chart trade growth index economy concept.
Businessman showing rising sign Stock chart with graph indicator in laptop. financial data exchange
Graph changes lines with points, bars with numbers
Double exposure Candle stick graph chart with indicator coin stacked on technology financial graph background. Finance and investment concept.
Stock Chart
Stock Chart
Stock market or forex trading graph in graphic concept suitable for financial investment or Economic trends business idea and all art work design. Abstract finance background. Vector illustration
Stock index numbers. Stock exchange market chart, Stock market data on LED display. Investing and stock market concept
The tablet with KEY ACCOUNT on chart with pen and glasses
Hand touching graphs of financial indicator and accounting market
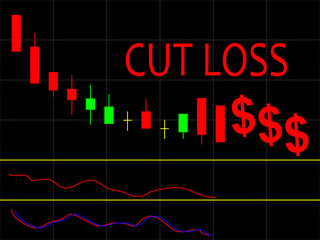
Businessman trade stock,profit in the stock market, loss from trading funds..
Bull and Bear Marketing Logo Inspiration
double exposure image of stock market investment graph and coins stack.
A client in casual wear is signing the contract to invest money in stock market. Internet trading and wealth management. Forex and financial hologram chart over the desk. Women in business concept.
Pulsing Financial Landscape Digital Overlay of Trading Data Across a Vibrant Metropolitan Backdrop
world economy. global finance. suitable for your business design
Technical price candlestick with indicator on chart computer screen background, Stock trading graphic design for financial investment trade, Forex graph business or Stock graph chart market exchange
Double exposure of abstract creative financial diagram on modern laptop background, banking and accounting concept
Abstract finance chart with red and Blue line graph. Finance data concept.
business man planning a graph  stock charts stock trading technology ideas
business man planning a graph stock charts stock trading technology ideas
Candlestick chart of trading on the stock exchange. Trading cryptocurrency, stocks and bonds. Candlestick patterns in cryptocurrency trading. Design for banners and posters. Vector illustration
Illustration of global economic trends with interconnected graphs and world map, SEO global economic trends, financial analysis, world economy, economic data
Modern data visualization of the finance crisis, with a  glowing chart and shiny background, stock market business, glowing diagram indicator.
Modern data visualization of the finance crisis, with a glowing chart and shiny background, stock market business, glowing diagram indicator.
Smiling woman with smartphone, infographics
Modern stock market trading background with a vibrant bar graph. Perfect for illustrating finance, economic trends, growth, money, trade, business, technology, and information charts and diagrams.
Businessman handle tablet show a trend down virtual graph finance,  invest in trading. Planning analyze indicator and strategy buy and sell, Stock market concept.
Businessman handle tablet show a trend down virtual graph finance, invest in trading. Planning analyze indicator and strategy buy and sell, Stock market concept.
finance, graph, investment, chart, background, economy, financial, growth, money, stock. urban in front of, financial trends solid, yellow and blue line graphs in city background visualizing pulsing.
Close up of investor women using laptop computer trading stock market via apps online at home, indicator analysis index chart graph trend line, investment and financial business concept.
Businessman holding coin with  graph. Double exposure of financial graph and city.Technical price candlestick chart graph and indicator stock online trading. Forex investment business.
Businessman holding coin with graph. Double exposure of financial graph and city.Technical price candlestick chart graph and indicator stock online trading. Forex investment business.
Hand touching  graphs of financial indicator  accounting market economy analysis chart
Hand touching graphs of financial indicator accounting market economy analysis chart
Collage of contemporary art. Photo of successful mature Socrates man in suit and tie advertising and pointing finger on golden bitcoin isolated over dark gray background. The man in a suit.
Stock market or forex trading graph in graphic concept
Abstract economic graph backdrop with money symbols, ample copy space, natural light
Financial graph highlighting strategic growth and profit maximization, with a focus on clean and polished visuals
Black calculator and financial statistics on clipboard
Stock market digital graph chart concept. A large display of daily stock market price and quotation. Indicator financial with buildings background
Hand touching  graphs of financial indicator market analysis chart
Hand touching graphs of financial indicator market analysis chart
Double exposure of abstract creative financial diagram with world map and modern digital tablet on background, banking and accounting concept
2021 and red arrow up over the Business Documents with phone, represents growth in the year 2021, isolated in white background. 3D illustration
Hand touching a graphs of financial indicator and accounting market economy analysis chart
Candlestick chart of trading on the stock exchange. Trading cryptocurrency, stocks and bonds. Candlestick patterns in cryptocurrency trading. Design for banners and posters. Vector illustration


Why Wallsheaven is special?

30 Days on Returns

You can return or replace any product within 30 days without reason.

Free Express Delivery

Delivery is free for all of our products, wherever you are.

Eco Water-Based Inks

Our prints are odorless, ecological, and safe for children with vivid colors from natural dyes.

Simple Installation

Installing WallsHeaven's wallpaper mural is as easy as making paper airplane.

Artist Support

By choosing our photos, you will support the artists from all over the world.