
WallsHeaven makes decorative wall murals in high quality printing

664,396 Datum+market+profit Wall Murals - Canvas Prints - Stickers

The market chart is a graph of a business growing stock value or financial data profit showing the growth of money on a background with success diagrams.
3d rendering Stock market online business concept. business Graph
Finance and Money Transaction Technology Concept. Icon Graphic interface showing fintech trade exchange, profit statistics analysis and market analyst service in modern computer application.
2d rendering Stock market online business concept. business Graph
Business partners reviewing financial data on a tablet, analyzing graphs and discussing business strategy
the picture of the data analysis staff watching the trend of the stock markets around the world
An upward arrow on an isometric 3D chart indicates a bullish stock market trend
Broker analyzing live stock market charts, reviewing detailed graphs and metrics to guide immediate trading actions. The broker relies on the real-time data to make informed financial decisions
Market research of gold trade charts on growth financial business money market 3d background with profit investment graph data concept and global economy currency diagram prices.
Tablet computer with a bar graph
Business 3d gold chart growth stock market financial investment exchange on money graph bar background of golden trade diagram finance analysis or economy wealth price currency invest profit concept.
Graph with covid decrease report. Diagram with coronavirus recession and bankruptcy progress
Stock market data on digital LED display. Fundamental and technical analysis with candle stick graph chart of stock market trading to represent about Bullish and Bearish point.
bullish Diagram - Graph Stock Trading
Investors and finance professionals collaborating during a virtual conference call to analyze market trends financial data and investment strategies for business success
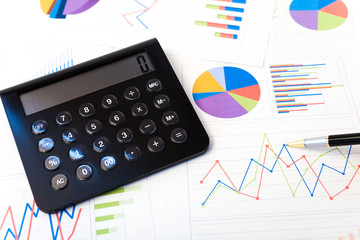
Finance background with money, stock market chart, graph and pen. Economy and business concept.
A computer monitor shows a red line on a graph
Digital online marketing, Businessman using tablet to analyze sales data and Economic growth chart chart, business planning and strategy, forex trading analysis. Stock market
Stock market finance business, economy trend graph digital technology.
Stock market chart. Big Data. Business Graph. Investment graph. Abstract financial chart. 3D rendering.
Candle stick graph chart with indicator showing bullish point or bearish point, up trend or down trend of price of stock market or stock exchange trading, investment concept.
A computer monitor displays a series of graphs and numbers. The screens are lit up in red, creating a sense of urgency and importance. Scene is intense and focused
Trader businessman calling to consultant or partner with two stock exchange investment, compare data analysis to invest high profit value dynamic financial technology stock market at office. Surmise.
3d rendering Stock market online business concept. business Graph
Investor Portfolio Financial Concept. Tiny Business Characters at Huge Briefcase with Magnifying Glass, Money Piles
Vibrant digital dashboard displays fluctuating financial charts, graphs, and market data on a futuristic blue grid,
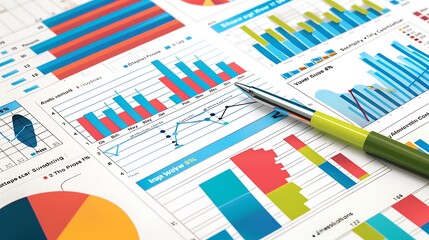
Background conceptual image with market graphs and diagrams
Broker analyzing live stock market charts, reviewing detailed graphs and metrics to guide immediate trading actions. The broker relies on the real-time data to make informed financial decisions
silver plate with chart (14)
Business team collaboration discussing working analyzing with financial data and marketing growth report graph in team, presentation and brainstorming to strategy planning making profit of company.
Digital charts, graphs, and indicators illustrate stock market expansion, business investments, and data analytics
Stressed trader viewing fluctuating stock market data on computer screen in dark office.
Dynamic wave of a sports field blending with stock market data, symbolizing the financial impact of sports events
Successful, confident  businessman looks positive at market growths lines, financial reports, financial predictions. Business concept
Successful, confident businessman looks positive at market growths lines, financial reports, financial predictions. Business concept
hand drawing graph chart and business strategy as concept
Business Candlestick Chart of Stock Market Trading Bullish Trend Vector Illustration on White Background
Close-up of financial charts and a pen, showing data analysis and business planning.
The role of consistent growth in achieving financial stability.
Stock market business Digital financial chart and exchange financial growth graph. Businessman Using Laptop and Tablet to Company Growth, Business Growth Arrows, Development Goals, Financial Data
Growth graph and investment analysis.Concept of business growth, profit, development and success.Presentation financial marketing graph on development and profit stock market.
Person analyzing stock market data on multiple screens in an office setting.
Scene is serious and focused
Big Data Technology for Business Finance Analytic Concept. Modern interface shows massive information of business sale report, profit chart and stock market trends analysis on screen monitor. uds
Female hand holding a phone with a stock market graph on blue background.
Candle stick graph chart with indicator showing bullish point or bearish point, up trend or down trend of price of stock market or stock exchange trading, investment concept.
Stock exchange market concept, hand trader touching on smartphone with graphs analysis candle line on bokeh colors light in night atmospheric city.
2d rendering Stock market online business concept. business Graph
Broker analyzing live stock market charts, reviewing detailed graphs and metrics to guide immediate trading actions. The broker relies on the real-time data to make informed financial decisions
silver plate with chart (14)
Global trading financial business stock market chart and technology trade exchange finance graph on digital economy price 3d background with profit investment. Elements of this image furnished
business graph with arrow
Digital banking concept, new technology network using for digital money exchange, data on cloud commercial, online banking, hologram bank and connection technology
Stock market forex finance business trading graph infographic futuristic banner background,
financial chart
financial chart
Stock market graph trading analysis investment financial, stock exchange financial forex graph stock market graph chart business crisis crash grow up profits win up trend server digital
Macro shot of a solar panel texture with financial graphs showing renewable energy market trends
Red 3d arrow going down stock icon on white background. Bankruptcy, financial market crash icon for your web site design, logo, app, UI. graph chart downtrend symbol.chart going down sign.
Businessmen are touch on the rapidly growing stock chart. analyzed and planned to run the business. Double exposure city and light, future business planning concept, growth, finance, energy saving.
Analyzing data sales and financial graph chart. Business development strategy,analysis and planning.Financial marketing graph and profit stock market.
Analysts workplace. A table with charts, black-rimmed glasses and a glass magnifier. Tax calculation, report or stock market analysis. Business concept
A technical financial graph against an abstract technology background
Big Data Technology for Business Finance Analytic Concept. Modern interface shows massive information of business sale report, profit chart and stock market trends analysis on screen monitor. uds
stock market investments using smartphones to analyze trading data. smartphone with stock exchange graph on screen.
Businessman planning digital stock market analysis strategy Technology chart showing positive growth. investment finance
Financial accounting of profit summary graphs analysis. The business plan at the meeting and analyze financial numbers to view the performance of the company in stock market exchange.
chart
chart
Financial charts
Financial charts
financial reports
financial reports
blue data space
blue data space
3d rendering Stock market online business concept
Finance background data graph.
Financial charts and graphs. 3d render ..
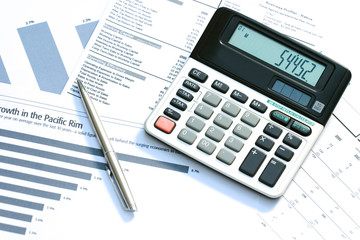
Finance Data analyzing with calculator  Economy Investment planning budget
Finance Data analyzing with calculator Economy Investment planning budget
Stock market graph analysis. Stock market data on LED display on laptop screen for finance and economic. Business graph background.
 Stressed businessman sits in panic digital stock market financial background.
Stressed businessman sits in panic digital stock market financial background.
2d rendering Stock market online business concept. business Graph
Business candle stick graph chart of stock market investment trading on blue background. Bullish point, Trend of graph. Eps10 Vector illustration.
Financial accounting stock market graphs analysis
Financial stock market infographics, financial information
3d isolated bar chart decrease with reflection business growth or stock fall with red downtrend arrow, statistics forecast, financial profit
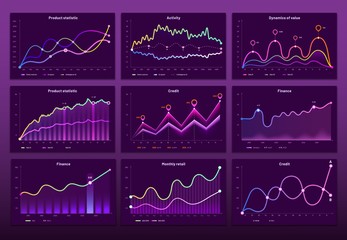
Line graph charts. Business financial graphs, marketing chart graphics and histogram infographic. Economy data graph, crypto currency prices bar or analytics analysis diagram vector set
Data Analysis for Business and Finance Concept. interface showing future computer technology of profit analytic, online marketing research and information report for digital business strategy. uds
Stock market or forex trading graph in graphic concept
Stock market graph on LED screen monitor
ETF concept with stock market quotes digital display and financial data
Stock market or forex trading graph in futuristic concept for financial investment or economic trends .
Accounting concept
Accounting concept
Business strategy and digital marketing concept. Business person analysing economic growth graph financial data. Stock market investment. Financial and banking Technology.
Bitcoin and USD dollar banknote with red graph stock market chart and down arrow , Economic downturn and recession concept.
Stock market investment trading financial, coin and graph chart or Forex for analyze profit finance business trend data background.
Stock exchange market graph. 3d illustration
3d rendering Stock market online business concept. business Graph
Stock market. Exchange trade. Stock quotes. Tracking rate fluctuations. Volatility. Japanese candlestick. Investing in various assets. Stock market game. Broker's work.
Stock market graph analysis. Stock market data on LED display on laptop screen for finance and economic. Business graph background.
3d rendering Stock market online business concept. business Graph


Why Wallsheaven is special?

30 Days on Returns

You can return or replace any product within 30 days without reason.

Free Express Delivery

Delivery is free for all of our products, wherever you are.

Eco Water-Based Inks

Our prints are odorless, ecological, and safe for children with vivid colors from natural dyes.

Simple Installation

Installing WallsHeaven's wallpaper mural is as easy as making paper airplane.

Artist Support

By choosing our photos, you will support the artists from all over the world.