

WallsHeaven makes decorative wall murals in high quality printing

1,513,162 Datum+market+chart Wall Murals - Canvas Prints - Stickers

Stock market or forex trading candlestick chart exchange uptrend. Stock broker monitor  economic graph with diagrams, business and financial concepts reports. Technology communication concept
Stock market or forex trading candlestick chart exchange uptrend. Stock broker monitor economic graph with diagrams, business and financial concepts reports. Technology communication concept
Black man finger touch forex diagrams, stock market data with chart
Graph growing up vector icon. economy graphic growth arrow rise. market chart sign isolated on white background. development forecast plan stock illustration
circular image of bright light, kaleidoscope of numbers and charts representing market data
Abstract financial chart with trend line graph and bar chart in stock market on white color background
Digital stock market background with global data analytics and financial charts illustrating worldwide economic trends and statistics
simple column color charts
A futuristic digital screen with AI-generated analytics for market analysis. Data points and charts are dynamically updating, Generative AI
Business growth in 2025, stock market investment and digital assets, businessman analyzing financial data using graphs and charts, success and motivation in 2025
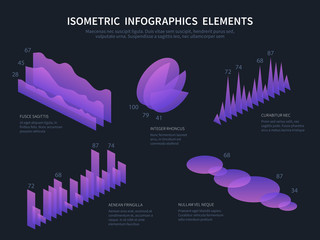
Isometric infographics elemnts. Business graphics, statistics data charts and financial bar diagrams. 3d infographic vector set. Illustration of purple 3d visualization, statistic business
bear on a vibrant background with cryptocurrency trading charts and data Illustration of a bear market downtrend
Business graph on a blackboard
Dynamic stock market graph with blue and orange lines on dark background, featuring candlestick charts and a red line indicating significant upward growth with blurred light effects.
Business laptop analyzes data and analytics for marketing strategy planning. A close-up of a modern computer screen displaying charts and tables related to finance and success. Ai generative.
Presentation Template design. Business data graphs. Vector financial and marketing charts.
2024 Bar chart and growing up. Business achievement goal and objective target. economic and financial growth. 2024 fast growth chart. Financial data concept. 3d illustration
War stock trading bull and bear market concept with stock chart crisis red price drop arrow down chart fall. The concept of making a profit on a falling market
Stock trading theme with person using a laptop computer
Green uptrend stock market,green bar and the line graph feeling that rise, growth, motivation, hope, and bull stock market after war crisis and pandemic. Background for the economy and data analysis.
Financial Analyst Working on a Computer with Multi-Monitor Workstation with Real-Time Stocks, Commodities and Exchange Market Charts. Businesswoman at Work in Investment Broker Agency Office at Night.
Managers of marketing team analyzing visitors activity and making conclusion on efficiency of new website or application
Black man finger touch forex diagrams, stock market data with chart
Business graphs and charts on table. Financial development, Banking Account, Statistics
chart line growing bars with rising arrow and megaphone 3d illustration data analysis announcement
Male professional monitoring multiple screens with stock market data in a dimly lit, high-tech trading room.
person analyzing financial data charts
Financial futuristic blue charts and graphs and coins stack background
Business man trader investor analysis for stock market concept for trading fund data statistic
Set of colorful circle percentage diagrams for infographics, 0 5 10 15 20 25 30 35 40 45 50 55 60 65 70 75 80 85 90 95 100 percent. illustration.
Financial background
Team of investors works late at night in an office, analyzing charts and data on computer screens, discussing strategies for success in the financial market
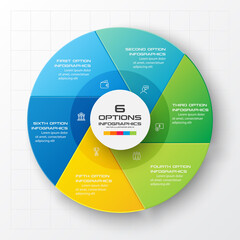
Circle chart infographic template with 6 options,Vector illustration.
Dynamic stock market graph with blue and orange lines on dark background, featuring candlestick charts and a red line indicating significant upward growth with blurred light effects.
close-up view of a stock market data board with stacks of coins on background (3d render)
vector illustration Can be used for process, presentations, layout, banner,info graph There are 9 steps or layers.
Abstract financial graph with up trend line in stock market on blue color background
Data Analysis logo simple and modern
Stock Market Analytics Charts Business Concept
Vector circle arrows infographic, cycle diagram, geometric graph, presentation chart. Business concept with 7, options, parts, steps, processes. 16x9 slide template.
Finger pointing at screen showing stock market charts, Commodities and exchange market charts, Business man at work in investment broker agency.
Double exposure Rows of coins of cash,money, dollar on the table,finance and business concept,Tex time soft focus and blurred style,dark tone.
Abstract stock market chart with blue and red bars, a line graph on a grid, representing financial data analysis. 3D Rendering
Pie chart presentation infographic business marketing or financial analysis concept background 3d illustration
Business people touch graphics technology To analyze the income of the organization Through the laptop of the overall picture of the year Business assessment ideas in 2021
Business charts and diagrams on digital tablet
Businessman working with modern computer virtual dashboard analyzing finance sales data and economic growth graph chart and block chain technology.
Explore the vibrant scene of a stock exchange floor, where digital screens highlight rising stock prices and charts of economic growth, capturing the optimism of traders.
Focused financial analyst examining complex stock market data on computer screens in a dark office. Financial Analyst Monitoring Stock Market Data.
Businessman using a tablet with financial graphs and stock market charts, a virtual hologram of data on the screen, a business technology concept. Double exposure effect, with a bokeh background.
Businessman holding virtual technical graph and chart for analysis , stock market and trader concept.
Infographic element collection. Vector flat color illustration set. Column bar chart isolated on white. Histogram and process diagram. Design for ui, science poster, marketing, presentation
Candle stick graph chart of stock market investment trading
Globe with financial papers
Computer laptop with  business chart
Computer laptop with business chart
Computer showing analysis chart and graph in office
Businessman holding a graph showing growth
A close-up view of stock market data on a screen, featuring vibrant financial charts, symbolizing trading, investments, and market analysis.
Futuristic holographic digital trading platform with live market updates and data visualizations  Showcasing a sophisticated technology driven financial dashboard with interactive charts graphs
Futuristic holographic digital trading platform with live market updates and data visualizations Showcasing a sophisticated technology driven financial dashboard with interactive charts graphs
Robot trader is analyzing stock market data on multiple monitors with charts and numbers
Complex financial charts and graphs overlayed indicating market trends, set against a white-to-blue gradient background, symbolizing data analysis
circular image of bright light, kaleidoscope of numbers and charts representing market data
Stunning 3D graphics for your presentations. Make your data shine with vibrant charts on a clean white background.
Data analyst working on business analytics dashboard with charts, metrics and KPI to analyze performance and create insight reports and strategic decisions for operations management on virtual screen.
teamwork preparation Find brainstorming papers, share ideas on your desk. In the data taken from the laptop, graphs, financial charts are analyzed and calculated together.
Stock market charts on the digital screen. Stock market trading concept
Young businesswoman looking of stock market graph on screen
Investor increases revenue share small business stock market report and financial dashboard with key performance indicators (KPI) finance chart of business intelligence (BI)
Businessman using a tablet with financial graphs and stock market charts, a virtual hologram of data on the screen, a business technology concept. Double exposure effect, with a bokeh background.
Stethoscope and digital tablet on report chart paper
stock market trading room with multiple charts and graphs displayed on large screens
finance business card logo template with candlestick market chart icon
Dashboard and business finance report. investment or website SEO screen concept. Blue rising arrow and profit bar graph with multiple arrangements of coins. 3d rendering
Blue transparent pie chart business diagram over white background, financial growth, statistics or investment graph concept
Late Evening Business Office: Professional Analyst Works on Desktop Computer, Doing Final Report, Working with Charts, Graphs. Modern Business Office
An abstract cutout style candlestick chart pattern with the words Risk Reward.
Colorful pie charts and splashes represent data analysis and customer segmentation in this abstract image.
People crowd in form of pie chart composed of people. Statistic concept.
futuristic 3d stock market data visualization with glowing neon graphs charts and financial symbols floating in virtual space conveying growth and technological advancement
financial growth charts on a large screen with in a dark room highlighting business strategy and planning precise and impactful
Complex financial charts and graphs overlayed indicating market trends, set against a white-to-blue gradient background, symbolizing data analysis
Businessman analyzing stock market data on a digital screen.
Vibrant closeup of a glowing stock market display showcasing dynamic charts and graphs, representing economic trends and market fluctuations
Stock Market charts on a futuristic screen, Stock market trading floor
Stock market crisis charts analysis investing for growth and counting losses. Generative AI
Explore the stock market trends for 2024 with analytical visuals of businessman planning long term investments and future business growth, Navigate towards success with smart strategies.
Mega set of medical infographic elements data visualization vector design template. Can be used for steps, options, workflow, diagram, flowchart, timeline, marketing. Bundle medicine info graphics.
Night computer, stock market hologram and man with crypto finance chart, bitcoin dashboard hud or NFT statistics. Investment data analysis, trading or back of forex account manager point at future ui
Businessman using a tablet with financial graphs and stock market charts, a virtual hologram of data on the screen, a business technology concept. Double exposure effect, with a bokeh background.
coins with trading chart in financial concepts  with growth financial data concept or investment market profit bar and success market stock technology currency report with Generative AI
coins with trading chart in financial concepts with growth financial data concept or investment market profit bar and success market stock technology currency report with Generative AI
A digital background with stock market candlestick charts and graphs
Charts Graphs paper. Financial development, Banking Account, Statistics, Investment Analytic research data economy, Stock exchange Business office company meeting concept.
Businessman hand Project manager working and update tasks with milestones progress planning and Gantt chart scheduling virtual diagram.
Gold bar resting investment on a stocks graph representing
Overlay, blockchain and woman networking on a digital global communication website, email and internet. Future, night and happy trader trading on the stock market while on social media for world news
Market segmentation and data analysis pie charts in color.


Why Wallsheaven is special?

30 Days on Returns

You can return or replace any product within 30 days without reason.

Free Express Delivery

Delivery is free for all of our products, wherever you are.

Eco Water-Based Inks

Our prints are odorless, ecological, and safe for children with vivid colors from natural dyes.

Simple Installation

Installing WallsHeaven's wallpaper mural is as easy as making paper airplane.

Artist Support

By choosing our photos, you will support the artists from all over the world.