



WallsHeaven makes decorative wall murals in high quality printing

1,578,027 Chart+investment+graph Wall Murals - Canvas Prints - Stickers

A bold line graph showing a significant upward trend in stock prices, on a dark slate background, reflecting positive investment prospects.
株価のローソク足グラフと虫メガネ
株価のローソク足グラフと虫メガネ
Stock market business and exchange financial growth graph Investment finance chart
Creative forex wallpaper
Abstract financial chart with downtrend line graph and arrow in stock market on red color background
Stack of money flat vector.
Stock market digital graph chart on LED display concept. A large display of daily stock market price and quotation. Indicator financial forex trade education background.
Close-up of a hand pointing to a digital financial chart on an interactive touchscreen
Business candle stick graph chart of stock market investment trading, Bullish point, Bearish point. trend of graph vector design.
Economic recovery concept with the line charts
arrow down crisis economy people crowd around people falling chart economy investment
"Financial Planning" text on paper charts showing the results of successful.Calculator coins laptop and glass - business, banking, finance and investment concept
Cannabis business with marijuana leaves and stock graph charts on stock market exchange trading analysis investment, Commercial cannabis medicine money higher value finance and trade profit up trends
3d Blue growth graph business chart data diagram on success financial presentation background with abstract up arrow bar symbol or finance marketing price statistic and economy market
Stock market  trading graph candlestick chart suitable for financial investment concept, business chart and coins
Stock market trading graph candlestick chart suitable for financial investment concept, business chart and coins
Stock market trading graph and candlestick chart on screen monitor for financial investment and economic concept.
Candle stick graph chart with indicator showing bullish point or bearish point, up trend or down trend of price of stock market or stock exchange trading, investment concept.
Stock market graph or forex trading chart for business and financial concepts, reports and investment on dark background . Vector illustration
Right investment for getting income
charts and graphs with statistics to innovative analyze business potential and forecast future development of companies growth.
Stock market volatility, world financial crisis tiny businessman lose money, fall global industry isolated on white, cartoon vector illustration. Concept trader roll down infographic.
Chicago skyline from Butler Field to financial district skyscrapers at sunset, Illinois, USA. Parks, gardens. Forex graph hologram. The concept of internet trading, brokerage and fundamental analysis
Abstract virtual financial graph hologram on empty corporate office background, forex and investment concept. Multiexposure
Increase product value to increase profit vector
Closeup of laptop or notebook computer and financial reports with colorful charts, graphs and diagrams for business performace and return on investment, ROI, analysis
Vector cartoon growth chart icon in comic style. Grow diagram sign illustration pictogram. Increase arrow business splash effect concept.
Financial data graph at stock exchange
Handsome businessman stands near huge graphic of growth conpany's idicators with big marker on his shoulder. Business analysis and planning, increase profits, business growth. Vector.
A businessman pointing to an arrow graph symbolizing corporate future growth plans. The concept of business development leading to success and continuous growth.
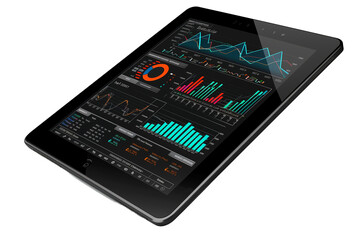
Analytical Business Data on Tablet Screen - Isolated on White Transparent Background, PNG
businessman a stock chart to determine buy and sell positions on the virtual screen of a tablet. information deciding buy stocks. Financial and stock chart investment growth.
Joyful businessman character standing look at the growth bar chart business illustration. Return on investment concept design.
Smiling mature man sitting on a graph chart and looking at camera
Photo blue growth graph business chart data diagram on success financial presentation background
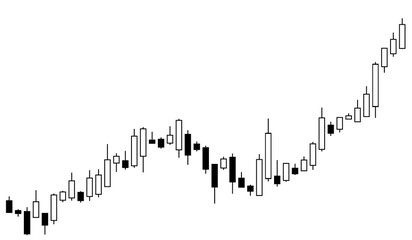
Stock market candle stick chart bullish uptrend growth
Stock market trading graph and candlestick chart on screen monitor for financial investment and economic concept.
Candle stick graph chart with indicator showing bullish point or bearish point, up trend or down trend of price of stock market or stock exchange trading, investment concept.
Shining rise up arrow on wooden cube blocks, bar graph chart steps from year 2021 to 2023 on blue background, business growth process, technology trend, economic improvement concepts, minimal style.
Abstract white background with Colorful charts and graphs with statistics to innovative analyze business potential and forecast future development of companies growth.
Economic critical crisis concept. The red graph drops down and charts on a red background. Recession financial, cryptocurrency, gold, and the stock market. Losing money and cash.
Blue Graph
Blue Graph
Multi exposure of abstract creative financial chart on computer background, research and analytics concept
3D arrow
3D arrow
Businessman with stock trade chart grow up display with space rocket taking off, night sky with milky way background
electric light bulb on wires and a graph of the growth of electricity prices, Crisis Concept
Negative chart of investment financial data. The concept of economic recession and crisis. Three falling charts of world trade
Dices cubes with the words SELL BUY, pencil and financial chart
Growing business 3d arrow on white, Profit red arrow, Vector illustration.Business concept, growing chart. Concept of sales symbol icon with arrow moving up. Economic Arrow With Growing Trend.
Green and red Japanese candlestick trading graph chart on white background. Market investment. Forex, stock exchange and crypto price technical analysis vector illustration. Traders tool
Dollar inflation graph with bright dollar sigh and  blur dollar note background.
Dollar inflation graph with bright dollar sigh and blur dollar note background.
Growing graph Icon. Chart sign and symbol. diagram icon
Green chart trader stock business market. Diagram indicator shiny glow data visualization. Generative AI technology.
Photo growth graph business chart data diagram on success financial graph presentation
Red Upward arrow on money coin stack as growth graph steps in home shape symbol,Savings, income, home investment, real estate price value, property profit concepts,the rising price of real estate.
Stock market trading graph and candlestick chart on screen monitor background. Financial investment and economic concept.
Graph going Down sign with red arrow vector. Flat design vector illustration concept of sales bar chart symbol icon with arrow moving down. logo, app, UI. graph chart downtrend symbol.
Businessman with magnifying glass search of investing and stock market. Gain and profits with candlestick charts. Stock Market Analysis. Finance data concept.
data graphics analysis
Abstract white background with Colorful charts and graphs with statistics to innovative analyze business potential and forecast future development of companies growth.
Forex graph hologram on table with computer background. Double exposure. Concept of financial markets.
business charts and graphs with eye glass and book note
Financial data document graph chart report statistic marketing research development  planning management strategy analysis accounting. Financial business technology hologram concept. 3d rendering.
Financial data document graph chart report statistic marketing research development planning management strategy analysis accounting. Financial business technology hologram concept. 3d rendering.
Forex trading technical analysis concept with candlestick chart
Trade and finance concept
red chart
red chart
Candle stick graph chart with indicator showing bullish point or bearish point, up trend or down trend of price of stock market or stock exchange trading, investment concept.
Magnifying glass lying on business charts and graphs. Business planning,accounting,analysis,financial planning and data Analysis concept.
Businesswoman working with computer, laptop, thinking and analyzing graph stock market trading with stock chart data planning, financial and investment concept
Abstract creative financial graph on modern laptop background, forex and investment concept. Multiexposure
Gasoline Fuel Gas Petrols Oil Stock Value Market Demand Price Hike Rise Increase Up Skyrocket With Graph Chart Diagram Vector Illustration. Can be Used for Web, Mobile, Infographic and Print.
Business candle stick graph chart of stock market investment trading on white background design. Bullish point, Forex, Trend of graph. Vector illustration
 Future-forward cityscape with digital grid overlay
Future-forward cityscape with digital grid overlay
Growth chart with data, 3d render
financial charts and graphs
target icon on the top of wooden cube blocks. Shining rise up arrow shoot up towards the goal, business growth process.
Business growth, progress or success concept. Businessman is showing hologram stock market investment profit report graph in bar chart on his hand with green arrow point up in dark background.
Stock graph charts on the stock market exchange price with investment of business financial digital background / Candle stick stock or forex trading indicator on computer monitor for investors -
Stock market or forex trading graph and candlestick chart suitable for financial investment concept. Forex trading candlestick chart economic , ECN Digital economy.
charts and graphs with statistics to innovative analyze business potential and forecast future development of companies growth.
Financial growth, innovation boost profit or sales, increase investment earning or stock market rising up, growing business for success concept, businessman riding rocket booster with growth arrow.
Financial profit and loss graph charts
businessman working data document graph chart report marketing research development  planning management strategy analysis financial accounting. Business  office concept.
businessman working data document graph chart report marketing research development planning management strategy analysis financial accounting. Business office concept.
IPO Initial Public Offering. Businessman investor invest in stock market shares. Company growth. Passive income. Investment. Traders standing with huge candlestick chart, arrow graph and gold coin
Business graph and candlestick charts interface.
Analyze. Macro view. 3d illustration of Financial documents with colorful 3D graphs and pie charts.
Candle stick graph chart with indicator showing bullish point or bearish point, up trend or down trend of price of stock market or stock exchange trading, investment concept.
Stock market trading graph and candlestick chart on screen for businese financial investment concept. Economy trends background. Abstract finance and invest background.
Upward bar graph and arrow
Stack of money coin with trading graph chart stock market. Value exchange and marketing of bank fund economic profit with growth. Finance investment and business concept.
Stock market trading graph candlestick chart suitable for financial investment concept and coins
Businessman graph concept
Fountain pen on stock chart
ブロック 階段
ブロック 階段
Stock market trading graph, investment chart
Double exposure of abstract creative financial chart hologram and world map on modern corporate office background, research and strategy concept
Colleagues discuss business charts and analytical prices using calculators and laptops to calculate finance, taxes, accounting, statistics, teamwork concept. Calculate personal taxes for clients
business finance graph 3d illustration


Why Wallsheaven is special?

30 Days on Returns

You can return or replace any product within 30 days without reason.

Free Express Delivery

Delivery is free for all of our products, wherever you are.

Eco Water-Based Inks

Our prints are odorless, ecological, and safe for children with vivid colors from natural dyes.

Simple Installation

Installing WallsHeaven's wallpaper mural is as easy as making paper airplane.

Artist Support

By choosing our photos, you will support the artists from all over the world.