


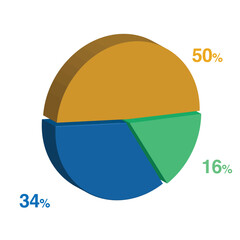


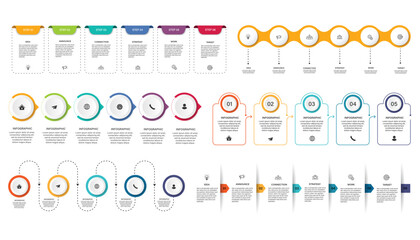


chart diagram
Wall muralbusiness datum infographic
Wall muralconcept finance vector
Wall muralillustration graphic information
Wall muraldesign presentation growth
Wall muralreport icon marketing
Wall muralsuccess background statistic
Wall muralfinancial stock process
Wall muralchart
Wall muraldiagram
Wall muralbusiness
Wall muraldatum
Wall muralinfographic
Wall muralconcept
Wall muralfinance
Wall muralvector
Wall muralillustration
Wall muralgraphic
Wall muralinformation
Wall muraldesign
Wall muralpresentation
Wall muralgrowth
Wall muralreport
Wall muralicon
Wall muralmarketing
Wall muralsuccess
Wall muralbackground
Wall muralstatistic
Wall muralfinancial
Wall muralstock
Wall muralprocess
Wall muralmarket
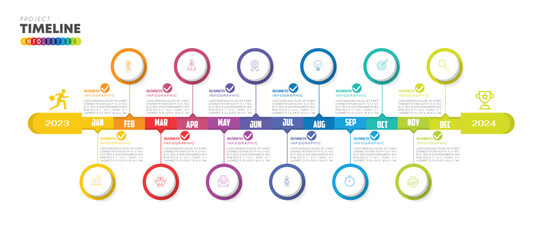
Wall muralstep
Wall mural


-and-place-for-text.-design-for-process-chart,-report,-banner,-workflow,-presentation.-editable-vector-eps-10-illustration:400:3:OfilOl4EYOdApVdLPgjQnUj4WfFFjpAy:261032386:as2.jpg)