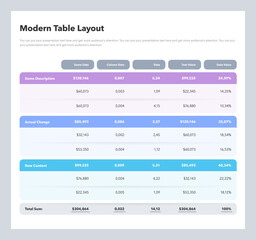
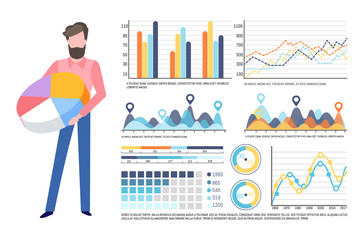
WallsHeaven makes decorative wall murals in high quality printing

1,983,059 Chart%2Bdiagram%2Bidea Wall Murals - Canvas Prints - Stickers

pyramid, triangle, chart, graph, diagram outline icon
Swash arrow business financial target background design template. Investment value economy growth concept.
Dark illustration inforgraphic with triangle divided to three parts
Rotating arrow icon.
Vector Infographic label design template with icons and 4 options or steps.
flow chart diagram
flow chart diagram
Analytics free Icon
Analytics free Icon
Circular isometric infographic template or element with 5 step, process, option, colorful 3D circle, tag, button, label, icons, row, bar, funnel, fishbone, tree diagram for sale slide, web, flowchart
two sided 50 percent pie chart vector, 50 percent pie chart vector illustration
Market Analyze. Bar graphs, Diagrams, financial figures. Abstract glowing forex chart interface wallpaper. Investment, trade, stock, finance
Hands taking pieces of pie chart PNG illustration with transparent background.
Set 4 3D colorful pie chart represents business financial economic divided into 3 parts with same portion and same height
2D illustration of tree root for diagram and chart
Modern Infografis profesional template elements
9 41 50 percent 3d Isometric 3 part pie chart diagram for business presentation. Vector infographics illustration eps.
Circle loading or circle progress collection. Set of circle percentage diagrams for infographics 0 10 20 30 40 50 60 70 80 90 100 percent in black and grey color. Vector infographics set.
A businessman scrutinizes business analytics on a virtual screen, displaying sales and operations data statistics charts
Modern infographic Timeline template can be used for workflow layout, diagram, number options, web design. Infographic business concept with 8 options, parts, steps or processes.
Finance industry to growth, person using laptop for financial, analysis, planning to long-term growth with icon concept.
Scrum info graphic diagram element vector set illustration. Agile diagram, recycle symbol and circle chart element collection. Group of blue and orange symbols for scrum methodology info graphic
Business growth graph chart
Graph Vector Icon
Graph Vector Icon
Cycle diagram with 3 options or steps. Slides for business presentation. Abstract infographics
Business Infographic template. Design with numbers 5 options or steps. 5 Steps Modern Timeline diagram with progress arrows, presentation vector infographic. Grey and green
Donut chart on purple background. 3D rendering.
financial crisis concept. Businessmen analyzing market fall vector illustration
Infographic square template in puzzle style. Vector cycle diagram with 6 parts, options.
Businessman using a computer  analysis for process and workflow automation with flowchart, a businessman in background
Businessman using a computer analysis for process and workflow automation with flowchart, a businessman in background
Vertical business timeline
Pareto Principle is an 80 20 rule analysis diagram. The illustration is a pie chart has eighty percent and another twenty parts for making decisions in time, effort and result or less is more concept.
Modern table layout template with a total sum row. Flat design, easy to use for your website or presentation.
venn diagram infographic template banner with triangle shape structure pyramid with 3 point list information for slide presentation
Infographic template with house divided on three elements with place for text and icons
A cityscape with tall buildings and a white circle with a pie chart on it
RGB and CMYK color mixing vector diagram. Additive and subtractive colors
Vector infographic template
Business infographics. Circle Chart with 4 parts, steps. Vector template.
Body parameters man and women in full length
Pie chart with five elements. Diagram, option graph, layout. Business data. Creative concept for infographics, presentation, project. Can be used for topics like marketing, analysis, workflow.
Butcher cart: meat cuts with Italian names for beef, calf, pig and sheep from a lexicon early '900
Analysis of data, visualized information vector. Schema and explanation, man with pie diagram and colored segments, graphics and infocharts info set
Infographic design template with place for your data. Vector illustration.
Male Biceps Muscle Chart Labeled on White Background
Dashboard infographic template with big data visualization. Pie charts, workflow, web design, UI elements.
Pollen Germination on Stigma
Business candle stick graph chart of stock market investment trading on blue background design. Vector illustration.
Circular chart color infographics step by step in a series of circle. Element of graph, diagram with 5 options- 20, 40, 60, 80, 100 percent, parts, processes. Vector business template for presentation
Statistics Analysis Business Data Diagram Growth Increase Marketing Concept , digital tablet and graph financial with social network diagram
Hand touching empty flow chart
Business circle infographic, diagram with options
Business Graphs and Charts
Vector set of nine graphs or charts with isochoric, isobaric, and isothermal processes. Constant volume, pressure, and temperature. Physics, chemistry, thermodynamics. Linear and exponential graphs.
Funnel Diagram Template
Colorful management or statistics concept infographic charts set. Business design elements for presentation slide templates. Can be used for financial report, workflow layout and brochure design.
Layered Pyramid Three Levels
Vector Infographic design with icons and 3 options or steps. Infographics for business concept. Can be used for presentations banner, workflow layout, process diagram, flow chart, info graph
A candlestick chart index
Graph, chart and diagram. Line icon set. Static analytical charts of economics, finance and business. Vector outline icon pack. Web icons in linear style. Collection pictogram
PERT chart or PERT diagram is a tool used to schedule, organize, and map out tasks within a project. PERT stands for program evaluation and review technique
red bussiness arrow and graph stock market arrow growing pointing up on economic chart icon trending upwards financial board rises
Venn colorful diagrams set
Infographic illustration of yellow and red triangles divided and cut into thirds and space for text, Pyramid shape made of three layers for presenting business ideas or disparity and statistical data
Chart candle stock graph forex market. Trade chart exchange background crypto currency. AI generated
Energy efficiency chart and house concept. Home icon vector. Solar power. Green home. Vector stock illustration.
3D rising arrow. Growth and profit shown by arrow up. Stock market profit growth forecast chart in purple color
Business chart design template. 4 options. Vector graphics.
Business data visualization. timeline infographic icons designed for abstract background template milestone element modern diagram process technology digital marketing data presentation chart Vector
Set of magnifying glass data analysis icons. Market research, analytic. Business analysis, financial forecast logo. Vector illustration.
Horizontal funnel diagram. Clipart image
Pie chart blue infographic set. Business analysis symbol for reports and presentations. Isometric round diagrams with different heights. Statistics information. Vector illustration isolated
Periodic table of the chemical elements on russian language. Educational vector multicolor chart illustration including new elements Nihonium, Moscovium and Oganesson.
Business infographic. Flower chart with 6 options. Vector template.
3d pie. Isometric cycle diagram for infographics in 5 parts. Vector chart can be used for graph, report, presentation.
pie chart logo , diagram logo
Infographic circle diagram template with 6 options. Can be used as a chart, graph, workflow layout, for web, report, business infographics.
Vector Infographic arrow design with 4 options or steps. Infographics for business concept. Can be used for presentations banner, workflow layout, process diagram, flow chart, info graph
Modern  infographic vector template with statistics and finance charts. Information Graphics elements for UI UX design. Website design vector template graph and diagram infographic. Vector
Modern infographic vector template with statistics and finance charts. Information Graphics elements for UI UX design. Website design vector template graph and diagram infographic. Vector
Vector circle arrows metaball infographic, cycle diagram, graph, presentation chart. Business concept with 6 options, parts, steps, processes. 16x9 slide template.
3d person drawing growth progress bar chart
Average sales report
British Pork Cuts Diagram
Business chart and graph
Brand Management Wheel
Work progress icons, pie chart divided into four quarters, icon set
Isometric charts percentage, diagrams, revenue growth graph. Business infographic vector  illustration, diagram pie chart symbols, different statistic parameters.
Isometric charts percentage, diagrams, revenue growth graph. Business infographic vector illustration, diagram pie chart symbols, different statistic parameters.
Pyramid Infographics. Funnel business pyramid with 5 charts
Set of circle percentage diagrams (meters) from 0 to 100 ready-to-use for web design, user interface (UI) or infographic - indicator with green
sunburst chart icon. Simple glyph vector element of charts and diagrams set icons for UI and UX, website or mobile application
Fishbone line diagram template. Clipart image
isolated bar chart with reflection improving business growth concept with uptrend arrow, statistics forecast, financial profit on white background
Atomic Spectra physics vector illustration infographic
49 51 forty nine fifty one 3d Isometric pie chart diagram for business presentation. Vector infographics illustration eps.
Abstract vector gradient minimalistic infographic template composed of 5 rounded squares
Banner of Stock market chart on world map background. Colorful Technical analysis with candle stick graph chart and numbers.
A fishbone or cause and effect 
 diagram is a  brainstorming tool to analyze the root causes of an effect. The vector featured a fish skeleton template for presentation with editable text
A fishbone or cause and effect diagram is a brainstorming tool to analyze the root causes of an effect. The vector featured a fish skeleton template for presentation with editable text
Circles divided in segments from 1 to 15 isolated on white background. Pie or pizza round shapes cut in equal slices in outline style.
Vector circle arrows infographic, cycle diagram, graph, presentation chart. Business concept with 5 options, parts, steps, processes. 16x9 slide template.


Why Wallsheaven is special?

30 Days on Returns

You can return or replace any product within 30 days without reason.

Free Express Delivery

Delivery is free for all of our products, wherever you are.

Eco Water-Based Inks

Our prints are odorless, ecological, and safe for children with vivid colors from natural dyes.

Simple Installation

Installing WallsHeaven's wallpaper mural is as easy as making paper airplane.

Artist Support

By choosing our photos, you will support the artists from all over the world.