


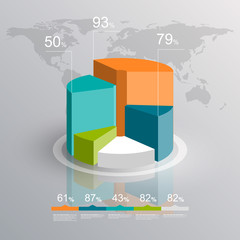


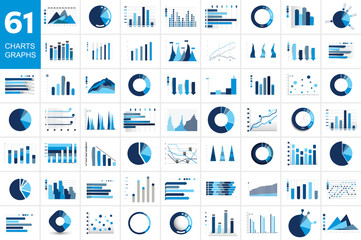


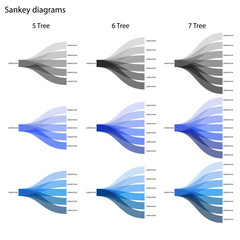


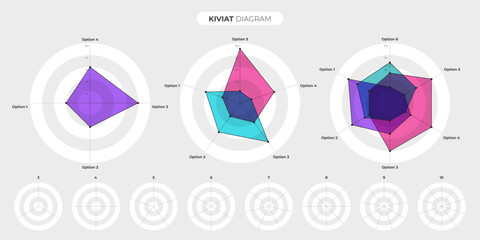


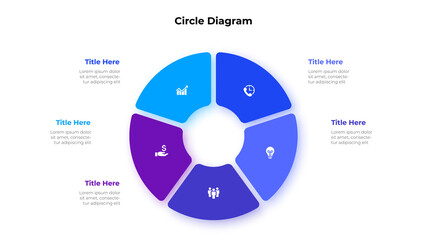
chart diagram
Wall muralbusiness graph statistic
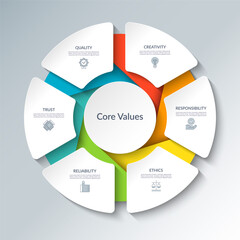
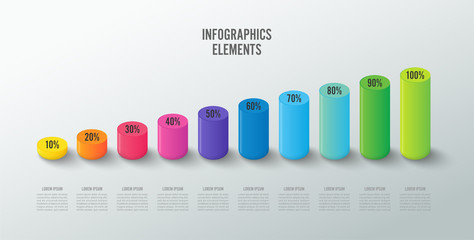
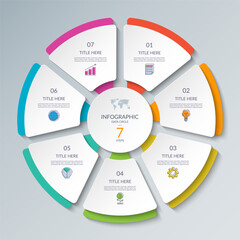
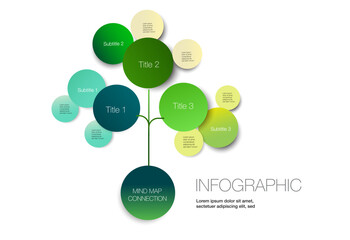
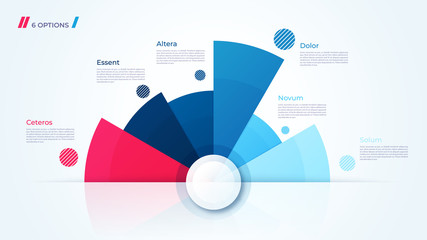
Wall muralinfographic graphic concept
Wall muraldatum illustration finance
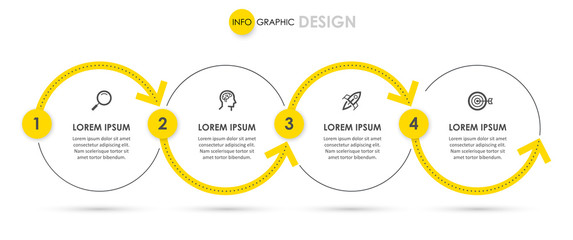
Wall muralinformation growth presentation
Wall muralicon symbol element
Wall muralbackground circle progress
Wall muralarrow success economy
Wall muralchart
Wall muraldiagram
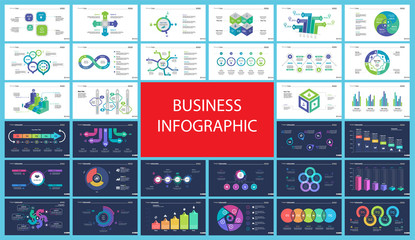
Wall muralbusiness
Wall muralgraph
Wall muralstatistic
Wall muralinfographic
Wall muralgraphic
Wall muralconcept
Wall muraldatum
Wall muralillustration
Wall muralfinance
Wall muralinformation
Wall muralgrowth
Wall muralpresentation
Wall muralicon
Wall muralsymbol
Wall muralelement
Wall muralbackground
Wall muralcircle
Wall muralprogress
Wall muralarrow
Wall muralsuccess
Wall muraleconomy
Wall muralprofit
Wall muralbar
Wall mural


