


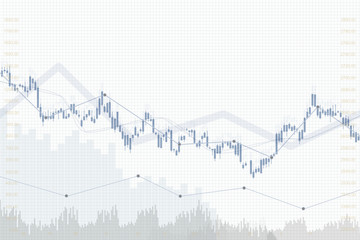


chart business
Wall muralbar graph statistic
Wall muralgrowth diagram datum
Wall muralillustration success graphic
Wall muralconcept vector investment
Wall muralsymbol design profit
Wall muralreport analysis progress
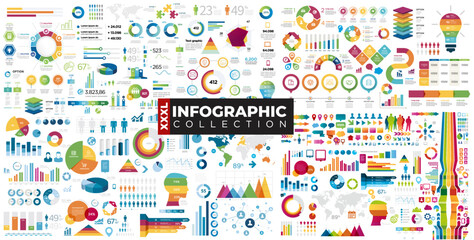
Wall muralinfographic economy element
Wall muralchart
Wall muralbusiness
Wall muralbar
Wall muralgraph
Wall muralstatistic
Wall muralgrowth
Wall muraldiagram
Wall muraldatum
Wall muralillustration
Wall muralsuccess
Wall muralgraphic
Wall muralconcept
Wall muralvector
Wall muralinvestment
Wall muralsymbol
Wall muraldesign
Wall muralprofit
Wall muralreport
Wall muralanalysis
Wall muralprogress
Wall muralinfographic
Wall muraleconomy
Wall muralelement
Wall muraltechnology
Wall muralsigns
Wall mural