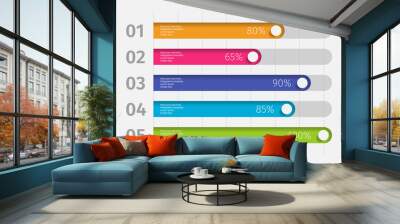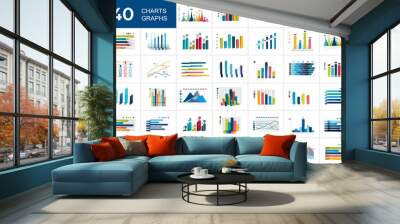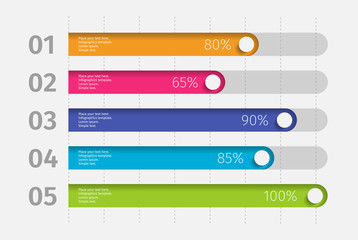

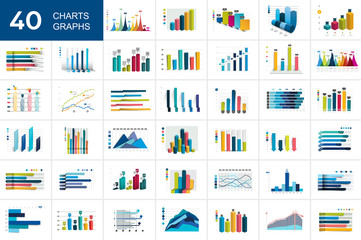


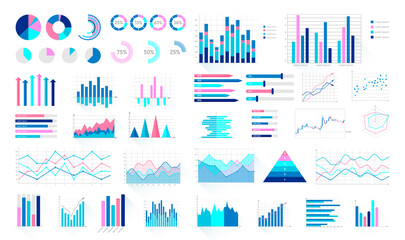


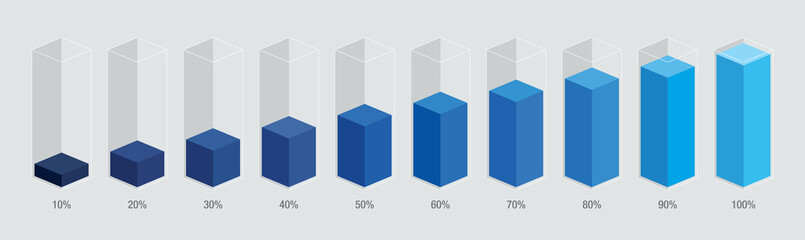
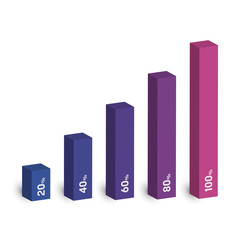


chart bar
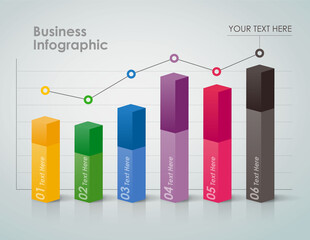
Wall muralgraph statistic business
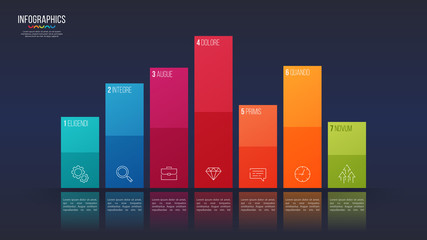
Wall muraldatum infographic diagram
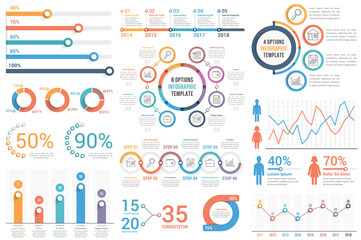
Wall muraldesign graphic report
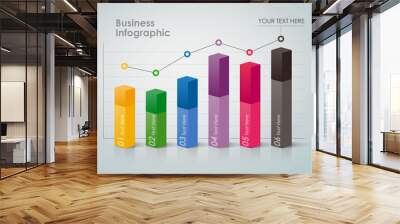
Wall muralillustration concept growth
Wall muralpresentation element information
Wall muraltemplate financial info
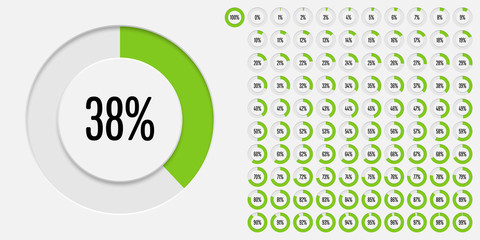
Wall muralicon background progress
Wall muralchart
Wall muralbar
Wall muralgraph
Wall muralstatistic
Wall muralbusiness
Wall muraldatum
Wall muralinfographic
Wall muraldiagram
Wall muraldesign
Wall muralgraphic
Wall muralreport
Wall muralillustration
Wall muralconcept
Wall muralgrowth
Wall muralpresentation
Wall muralelement
Wall muralinformation
Wall muraltemplate
Wall muralfinancial
Wall muralinfo
Wall muralicon
Wall muralbackground
Wall muralprogress
Wall muralmarket
Wall muralmarketing
Wall mural