WallsHeaven makes decorative wall murals in high quality printing

313,162 Analysis+management+trade Wall Murals - Canvas Prints - Stickers

Forex and stock market chart hologram over panorama city view of Bangkok, the financial center in Asia. The concept of international trading. Double exposure.
Stock market graph or forex trading chart for business and financial concepts, reports and investment on grey background . Vector illustration
Stock exchange market chart, Stock market data on LED display. Business analysis concept.
RFM Recency Frequency Monetary Value written in a note.
Business executives in a meeting with financial analysis data on digital screens.
Business graph and trade monitor . Mixed media
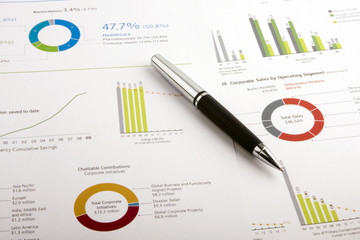
Financial accounting and marketing graphs analysis with a silver pen
Banking business finance and investment concept Businessman analyzing market data financial graph report economic growth business strategy planning and solution risk management : Generative AI
Market analyzing
Market analyzing
reviewing  the financial results.
reviewing the financial results.
Top down aerial view of data analysts wearing VR headsets stands around holographic of financial graph. Business people using hand gestures to manipulate the data from manager laptop. Directorate.
Fund trading concept. Interest rates continue to increase. Business man planning long term investments, business continue grow up, stock market volatility, taking high investment risks Fund management
Business analytics and technology Data analyst working on business analytics dashboard with charts, metrics and KPI to analyze performance and create insight reports for operations management. bigdata
Young Hispanic Male Stock Trader Working in Investment Management Firm. Latin Specialist Puts Buy And Sell Orders. VFX Hologram Edit Visualizing Stock Exchange Interface, Opened Charts With Price
Business team investors discuss stock trading chart growth research report Stock market price using PC computer tablet looking at screen Investment strategy analysis chart choosing the right direction
Professional using digital tablet to review and analyze the latest market data financial reports and investment strategies for informed decision making and portfolio management
Market chart of business glowing stock graph or investment financial data profit on digital tablet screen display background with diagram exchange information. 3D rendering.
Investment technology, financial, return on investment - ROI concepts. Increasing arrow, the exponential curve of progress in business performance over charts draws by pen in hand on dark background.
Business analysis and analytics online through the application on a laptop. Dashboard app with business analytics data, charts, investment, trade and finance management
Group of male entrepreneurs discussing management project during working together and analyzing accounting trade and experience in modern office.
Stock market trading graph and candlestick chart on screen monitor for financial investment and economic concept.
Accounting.
Accounting.
Stock market graph analysis. Stock market data on LED display on laptop screen for finance and economic. Business graph background.
Saving money concept Man hand putting Row and coin Write Finance Saving money concept Man hand putting Row and coin Write Finance
Businesswoman  analyzing  stock market.
Businesswoman analyzing stock market.
Pie chart show financial planning and investment, allocating money to invest in different types of assets, diversify and portfolio management
Crypto trader sitting in front of computers with multi-monitor workstation, making professional analysis of candlestick chart.
business graph
business graph
Hands typing the keyboard to research stock market to proceed right investment solutions. Internet trading and wealth management concept. Formal wear. Hologram Forex chart over close up shot.
Project management dashboard concept. Man holding phone with project management dashboard on screen.
Smiling businesswoman showing dynamic stock market on mobile phone to man partner analyzing profit value currency online website program comparing on computer at back side at home office. Infobahn.
Finance ans success concept
Trading and real estate investing concept with graph data and digital stock market, Financial and banking on business skyscrapers background.
Group of male and female entrepreneurs discussing management project during working together in modern office, confident business people analyzing accounting trade and experience about proud ceo
Red graph over cityscape
Professional at work analyzing financial data
Business, finance and investment, currency exchange concept. Accountant using calculator with coins and financial report, economic graph growth, finance background
Marktanalyse
Marktanalyse
Business analysis and analytics online through the application on a laptop. Dashboard app with business analytics data, charts, investment, trade and finance management
Financial stock trading graph chart diagram business finance concept double exposure mixed media.
Accounting
Accounting
Stock Market Graph and Bar Chart
Businessman or trader is showing a growing virtual hologram stock, invest in trading.
Detail graphics stock exchange
Stock trading theme with person using a laptop computer
Magnifier on business background. Use for company strategic beha
Busy old professional business man executive investor using computer working at desk. Male mature manager expert looking at laptop thinking on online finance market risk analysis in office. Side view
Image of candlestick graphic for stock market, trading analysis investment financial, stock exchange financial or forex graph stock chart graphic.
Businessman pointing at business document for chart and graph data analysis and accounting business woman holding pen and pointing at financial documents to analyze profit concept
Stock market graph analysis. Stock market data on LED display on laptop screen for finance and economic. Business graph background.
Big Data Technology for Business Finance Analytic Concept. Modern interface shows massive information of business sale report, profit chart and stock market trends analysis on screen monitor. uds
Global economy stock market finance chart business exchange investment data on growth financial graph world map 3d background technology economic money analysis digital trade profit diagram concept.
Various type of financial and investment in Bond market. i.e. ETFs, bonds, stocks, crypto currency Sustainable portfolio management, long term wealth management with risk diversification concept.
The word TRUST is written on wooden cubes. Wooden cubes lie on the table with sawdust and wooden blocks. Designed to promote your business. Marketing concept.
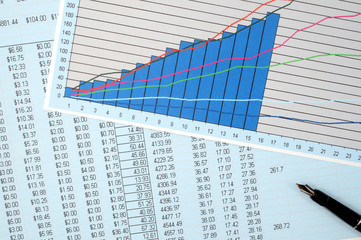
Financial graphs analysis
finance concept
finance concept
Financial background
Financial Stats
Financial Stats
Business analysis and analytics online through the application on a laptop. Dashboard app with business analytics data, charts, investment, trade and finance management
Business finance growth graph chart analysing diagram trading and forex exchange concept double exposure
Business and finance concept of office working,Teamwork of Businessmen discussing business plan in office
Marketing research and management concept. Bussinessman using laptops analyst working with data analysis business growth marketing and opportunity
Stock market trading graph and candlestick chart on screen monitor background. Financial investment and economic concept.
Double exposure of woman hands typing on computer and financial graph hologram drawing. Stock market analysis concept.
Business people or accountants are analyzing graphs on finance, investment, graph chart hologram in front, business strategy ideas, data analysis technology.
A satisfied crypto trader and investment strategist celebrates successful market analysis, underscoring astuteness and profitability in trading activities
Financial accounting, budgeting, stock market
Financial accounting stock market graphs analysis. Business planning
business vector illustration design Stock market charts or Forex trading charts for business and finance ideas.
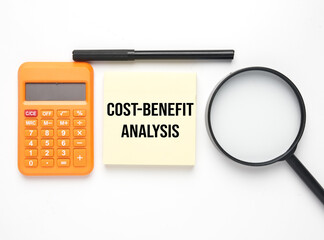
Calculator, magnifying glass, pen and notepad wirtten Cost-Benefit Analysis. cost-benefit analysis is a systematic process that businesses use to analyze during decision making
Stock trading investor finger pointing on dynamic financial data graph on monitor. Businessman or broker with analytic thinking analyzing data for stock market exchange trading company. Trailblazing
A business man wearing a suit Use the pen to direct the business technology, AI that shows work to connect a variety of working styles.
Financial development in business Shows increasing profit growth with an upward trend graph. currency symbol
Group of traders analyze stock market with multiple screen display stock graphs.commodities trades,day traders.
Hand choose strategy icon on wooden block for success, performance,management,and business  growth concept.
Hand choose strategy icon on wooden block for success, performance,management,and business growth concept.
Businessman analyzing sales data and economic growth and    pointing at business report document with graph chart financial diagram, marketing, banking and payments, business planning and strategy.
Businessman analyzing sales data and economic growth and pointing at business report document with graph chart financial diagram, marketing, banking and payments, business planning and strategy.
Energy crisis concept with oil refinery industry background,Double exposure.
ROBO Advisor concept. Man and robot hand shaking  on abstract investment management background.
ROBO Advisor concept. Man and robot hand shaking on abstract investment management background.
Businessman holding smartphone and virtual screen graph stock market indicator currency exchange financial management forex. business profit chart trade growth index economy concept.
Money growth business graph economy finance stock or currency investment financial diagram profit chart of global exchange market price shares on economic analysis 3d background with success trade.
Stock exchange market chart, Stock market data on LED display. Business analysis concept.
buildings and settlement in istanbul.
Stock market graph and ticker for businese analysis on LED screen monitor. Finance, Investing and exconomic concept.
Double exposure of woman hands typing on computer and forex chart hologram drawing. Stock market invest concept.
businessman or trader analyzing forex trading graph financial data, investor, cryptocurrency, Stock Market Investments Funds and Digital Assets, busines concept
Stock trading, data analysis diagram, chart, graph on virtual screen. Business and technology concept.
 2023 Budget planning and management concept. Company budget allocation for business or project management. Effective and smart budgeting. Plan, review, approve, allocate, analyze and optimize.
2023 Budget planning and management concept. Company budget allocation for business or project management. Effective and smart budgeting. Plan, review, approve, allocate, analyze and optimize.
world economics and global trading, abstract infographics, international business partnership, dashboard
business vector illustration design Stock market charts or Forex trading charts for business and finance ideas.
Supplier relationship management or SRM vendor analyze tiny person concept. Procurement planning or business deals strategy for organization supply partners vector illustration. Professional handshake
Financial stock exchange market display screen board on the street, selective focus. The concept of fundamental analysis. Double exposure.
Businessman touching the graph with his finger
Financial graphs analysis
Man using calculator Accounting Calculating Cost Economic bills with money stack step growing growth saving money in home , finance concept
Investment strategy line icon set. Analysis, graph, cash. Finance management concept. Can be used for topics like income, trade, business
Businessman using laptop analyzing sales data and financial growth graph chart report, generative ai
Analyzing Market Trends. A Businessman Analyst's Perspective. Generative AI
Pen with calculator on the financial graphs. Business concept. Top view.


Why Wallsheaven is special?

30 Days on Returns

You can return or replace any product within 30 days without reason.

Free Express Delivery

Delivery is free for all of our products, wherever you are.

Eco Water-Based Inks

Our prints are odorless, ecological, and safe for children with vivid colors from natural dyes.

Simple Installation

Installing WallsHeaven's wallpaper mural is as easy as making paper airplane.

Artist Support

By choosing our photos, you will support the artists from all over the world.