
WallsHeaven makes decorative wall murals in high quality printing

1,510,525 Analysis+graph+marketing Wall Murals - Canvas Prints - Stickers

3D infographic element, or graph with six(6) steps.
Blue stock exchange market graph on LED screen for business analysis. Finance and economic graphs.
laptop keyboard on technology financial graph background.
Magnifying glass and documents with analytics data lying on wood table
Seo analysis concept 3D illustration. Icon composition with site interface with data and statistics. Search engine optimization, website promotion strategy. Vector illustration for modern web design
Double exposure of woman's hands making notes with forex graph hologram. Concept stock market analysis.
business people discussing graph and chart reports at office
Businessman working on digital tablet analyzing sales data and economic growth graph chart, Banking, finance and investment, Business strategy, planning and solution, data analysis, market research
Startup business people group meeting, Business team meeting working with new startup project, discussion and analysis data the charts and graphs, professional business team
World map and orange digital graph
Moving Truck with Statistic Chart Bar for Marketing Financial Diagram  logo design
Moving Truck with Statistic Chart Bar for Marketing Financial Diagram logo design
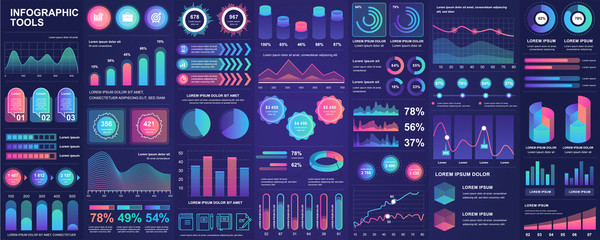
Graphs and charts templates. Big set business infographics. Statistic and data, information, economy. Financial chart. Vector illustration.
Business concept with businessman drawing graphs cost vs profit vector illustration
Double exposure of forex graph on digital tablet laying on table background. Concept of market analysis
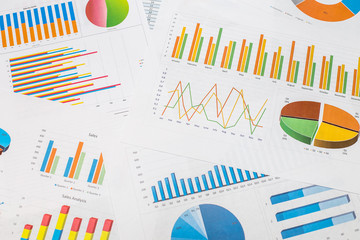
Financial printed paper charts, graphs and diagrams
Office person looking at business statistics. Employee with magnifier examining bar graph with up arrow flat vector illustration. Investment, success, finances concept for banner or landing web page
Stock market chart on blue background
Global economy stock market finance chart business exchange investment data on growth financial graph world map
Chart with profit and cost and businessman
business chart showing
Business graphs and magnifying glass on table
Dashboard UI, UX, KIT, great design for any site purposes. Business infographic template. Vector flat illustration. Income flow monitoring, stock market
Concept of data research, technology, data analysis and science. Modern flat design isometric concept. Landing page template.
business plan on wall
SEO analytics, data analysis, digital marketing strategy isometric concept
Forex graph on hand taking notes background. Concept of research. Multi exposure
Business data dashboard analysis by ingenious computer software . Investment application display business sales and profit on the computer screen and advise marketing planning decision
Business people are analyzing infographic data material. Various graphs are constructed on them.
Business people meeting explaining the financial graph data and marketing plan. Group of business people at meeting assessment the state of business investment and marketing.
3d finance and business icons set.  Money, stock exchange, business investment, trading and finance concept. Realistic 3d high quality render
3d finance and business icons set. Money, stock exchange, business investment, trading and finance concept. Realistic 3d high quality render
Business target market arrow concept on success goal background of growth digital marketing strategy achievement idea point focus or creative planning finance graph and financial aim targeting chart.
Market analysis graph showcases a prominent green arrow amidst rising figures, reflecting a surge in stock prices and financial growth
3d minimal data analysis icon. soaring finances. stock up. strengthening currency. a bar graph with an arrow up. 3d illustration.
Stock and bond market graph with trading desk bank office interior on background. Multi exposure. Concept of financial analysis
Group of traders discussing on office desk, monitoring stock market on monitor at office workplace. Businessman and broker analyzing stock graph together at stock trading company. Trailblazing
Graph of the housing market
business graph trading of stock market investment on blue background. chart finance candlestick and arrow growth. economy trend rising to success. vector illustration fantastic design.
Businessman hand show Stock chart showing rising stock sign with graph indicator. Interest rate financial and mortgage rates concept. Double Exposure Image. Blue technology background high tech.
Spreadsheet on Computer screen flat icon. Financial accounting report concept. office things for planning and accounting, analysis, audit, project management, marketing, research vector illustration
Successful of hand trader trading stock exchange graph money, global economic, trader investor, graph money of block chain stock market cryptocurrency selling and buy with price chart data graph
Investment concepts, investors with investment graphs, stock trading graphs, profit and loss graphs of operating businesses, planning and solving problems in business operations, stock trading.
Concept business strategy. Analysis data and Investment. Business success.Financial review with laptop and infographic elements. 3d isometric flat design. Vector illustration.
 Data visualization isometric concept banner
Data visualization isometric concept banner
stock market chart
stock market chart
Image of a researching scientist. Researcher. Wide image for banners, advertisements.
Stock market graph and table with computer background. Double exposure. Concept of financial analysis.
KPI Dashboard on virtual screen. Businessman analysing finance data graph on stock market. Financial management technology.	
Dashboard a wallet Account digital.
KPI Dashboard on virtual screen. Businessman analysing finance data graph on stock market. Financial management technology. Dashboard a wallet Account digital.
Business growth analysis with people working together with laptop and notebook
technical financial graph on technology abstract background
Business team collaboration discussing presentation and brainstorming to strategy planning making a profit of the company, working analyzing and financial data with marketing growth report graph
Blue Stock Exchange Market trading graph on screen monitor for economic and financial investment. Business analysis chart display. Stock invest infomation.
Finance concept
Finance concept
Stock and bond market graph with trading desk bank office interior on background. Multi exposure. Concept of financial analysis
business graph
business graph
Hand of young business man looking document data graph and chart paper, marketing and investment, report of statistics profit for financial, economic and growth of finance, management and planning.
Stethoscope with financial statement
Close up. two business people talking, planning analyze investment and marketing in office. Business meeting to brainstorm the new project and analysis data document.
business concept, business man try to predict economic by point and dragging the growth graph to make a benefit, profit, trend, market, success, grow up, turnover, financial,moeny
colorful chart graph
People working with analytics and data - Man and woman analysing business financial diagram and chart on big mobile phone screen. Flat design vector illustration with white background
Market Trend
Market Trend
Bundle infographic UI, UX, KIT elements with charts, diagrams, workflow, flowchart, timeline, online statistics, marketing icons elements design template. Vector info graphics and infographics set.
Investment planning and reporting concept. Chart, 3d graph . Reit concept
Tablet on desktop with glowing graph of success in 2020 year
Double exposure of businessman's hands with laptop and stock market graph background. Concept of research and trading.
handwriting up trend chart on graph paper with black pen and smartphone opening online stock trading application, close up
piggy bank despairing over bad financial report
Investment, financial performance report analysis concept, miniature people figurine success businessman standing and jooking at stock exchange data graph and chart document
Businessman using tablet analyzing sales data and economic growth graph chart.  Business strategy. Abstract icon. Digital marketing
Businessman using tablet analyzing sales data and economic growth graph chart. Business strategy. Abstract icon. Digital marketing
White bar chart on the blue arrow
Blue Stock Exchange Market trading graph on screen monitor for economic and financial investment. Business analysis chart display. Stock invest infomation.
Stock market graph on LED screen monitor
Multi exposure of stock market graph on conference room background. Concept of financial analysis
Business team meeting for planning or marketing strategy or brainstorming.
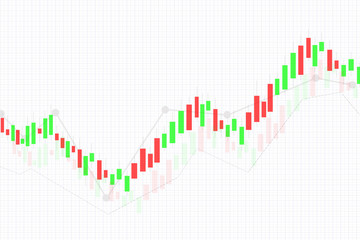
Candlestick chart
Candlestick chart
analysis on the monitor. Concept of fundamental and technical analysis. Stock market charts
Business candle stick graph chart of stock market investment trading on background design - Trend of stock market graph exchange financial economy concept
Team business meeting presentation. Hand businessman working project in modern office.Laptop computer and tablet and smart phone on white desk
Woman working with spreadsheets on desktop computer
Financial data document graph chart report statistic marketing research development planning management strategy analysis accounting, Financial business technology hologram concept, aesthetic look
finance report
finance report
Graph icon
Graph icon
Data analyzing Business candle stick chart of Display stock market investment trading , Business analyzing financial statistics Finance concept
Data analysis concept on white background
Financial forex graph displayed on hands taking notes background. Concept of research. Double exposure
Abstract virtual financial graph hologram on empty corporate office background, forex and investment concept. Multiexposure
Financial growth graph.?Sales increase, marketing strategy concept. Abstract Cover Design Vertical Format.
Business graph on a paper sheet
Female successful professional broker trader investor stand smile put hands in pants pocket look at camera in front computer monitor screen with stock and bitcoin cryptocurrency graph chart analysis
Hand touching a graphs of financial indicator  accounting market economy analysis chart
Hand touching a graphs of financial indicator accounting market economy analysis chart
Financial and business abstract background with candle stock graph chart. Bull vs bear concept traders concept
Stock market graph on LED screen background
Stock and bond market graph with trading desk bank office interior on background. Multi exposure. Concept of financial analysis
Achievement.
Achievement.
laptop and business finance graph 3d illustration
Stock market chart on computer display. Business analysis diagram
Cannabis business with marijuana leaves and stock graph charts on stock market exchange trading analysis investment, Commercial cannabis medicine money higher value finance and trade profit up trends


Why Wallsheaven is special?

30 Days on Returns

You can return or replace any product within 30 days without reason.

Free Express Delivery

Delivery is free for all of our products, wherever you are.

Eco Water-Based Inks

Our prints are odorless, ecological, and safe for children with vivid colors from natural dyes.

Simple Installation

Installing WallsHeaven's wallpaper mural is as easy as making paper airplane.

Artist Support

By choosing our photos, you will support the artists from all over the world.