WallsHeaven makes decorative wall murals in high quality printing

942,609 +statistic+information Wall Murals - Canvas Prints - Stickers

businessman showing digital graph
Blue Vector retro / vintage set of Infographic elements
90 percent people population demography, diagram, infographics concept, element design. Vector illustration
Business woman shows at graph on laptop and writing into notes or notebook.Computer screen with graphics and chart.
office scene
office scene
Vector people map of of State of California. The concept of population.
Young Woman Giving Presentation with Charts Displayed on Screen
business hand drawn sketch
Comparing statistics
Chart for infographic. Cube column chart.
2025 Golden Progress Bar Loading with Blurred Lights and Elegant Atmosphere in High-Definition Photographic Style
Double exposure of chart and financial info and work space with computer background. Concept of international online trading.
hexagon 3d illustration
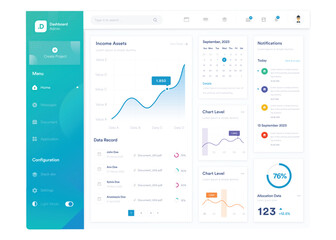
Infographic dashboard. UI design with graphs, charts and diagrams. Web interface template for business presentation.
Report chart, calculator, and stethoscope for financial report
A sleek modern pie chart displaying a split between black and orange segments, representing data analysis or statistical information
Close-up of a logistics manager using a digital interface to monitor delivery schedules and optimize routes
Gaining data insights, interpreting information
Team of businesspeople talking and making decision. People moving puzzle pieces with questions marks.
Infographic icon design
Histogram Flat Icon
Histogram Flat Icon
work on the calculator and papers
professional key performance indicator KPI metrics dashboard for sales and business results, system to strategic business planning concepts chart analysis
Closeup of a man analyzing financial data on a laptop with graphs on screen, modern office background.
Spreadsheet illustration concept, Business analysis and analytical, database report, financial accounting data with table number
Transparent charts seamlessly overlaying on a soft blue backdrop
Businessman analyzing financial report documents and investment portfolio review. Professional mature fund broker with computer and fact sheet of stock market and investment analysis planning
Double Exposure of a Pitching Finger on a Screen
Business targeting concept. Businessman touching darts aiming at target center with digital marketing icons on virtual screen internet network connection, Business goal, Digital online marketing.
Caucasian businesswoman manager sitting smiling preparing explaining presenting analysis statistic financial data information report documents paperwork on desktop to businessman colleague in office
Vector infographic template
Business, woman and team with presentation for data analysis, local ecology project or funding budget. Green finance, collaboration and sales statistics for social profitability and community support
Close Up of Computer Screen Showing Binary Numbers, Data Analysis and Calculation
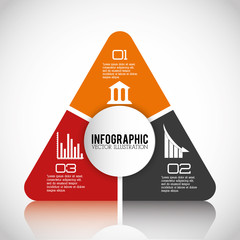
infographic template for annual report, magazine. infographic template for business, education, industry, science world. eight steps information template. colorful plus signs infographic template
Operations
Operations
Finance and Money Transaction Technology Concept. Icon Graphic interface showing fintech trade exchange, profit statistics analysis and market analyst service in modern computer application. uds
Summary report concept. Financial worker analyzing statistical data. Research chart, calculation. Compact data summary. Documents folder. Vector illustration flat design. Calculator pen in hand.
Simplifying complex information with effective data interpretation, clear insights
Stock market trading investment candlestick graph. Finance and economy concept. Generative ai
Investor data and information analysis chart for planning in strategy of stock market money or fund. Invest for earning or profit. Investment in business and financial concept of growth and success
3D Column Chart. Vector 3D clipart. Illustration in сlaymorphism style.
accounting,financial,close up of business man hand working on laptop computer with business graph information diagram on wooden desk as concept,vintage,selective focus
Collage young man run announce information bullhorn progress arrows stocks statistics positive result startup business career promotion
Scoreboard Team A Vs Team B Broadcast Graphic sticker isolated on gray background
Focused redhead businessman reviews project information while seated in a stylish, contemporary office.
Finance, analytics, marketing, development, teamwork, business concept. People business partners workers analysing financial data and information statistics and discussing projects together in office
 Close-up young businessman statistic graph of stock market financial indices analysis on a laptop and on a desktop computer in office. Analyzing and Trading Stock concept.
Close-up young businessman statistic graph of stock market financial indices analysis on a laptop and on a desktop computer in office. Analyzing and Trading Stock concept.
Business team using a calculator to calculate the numbers of statistic business profits growth rate on documents graph data, desk in the office.
Businessman analyzing financial report and investment portfolio review on tablet. Professional mature fund broker with laptop and fact sheet of stock market and investment analysis planning
Tablet with charts and reports on office desk workplace. Top view flat lay
Big data technology Data science analysing artificial intelligence generative AI deep learning machine learning algorithm Neural flow network analytics innovation abstract futuristic. 3d rendering..
Research and development, analyze data for insight information to improve. png illustration
Blue Water Gradient Chart Bars  Template. 10% to 100% number text. Flat Design Interface Illustration infochart infographic elements for ads app ui ux web banner vector isolated on white background
Blue Water Gradient Chart Bars Template. 10% to 100% number text. Flat Design Interface Illustration infochart infographic elements for ads app ui ux web banner vector isolated on white background
Young woman with glasses smiling while looking at data analytics on a screen, dark background.
Bar Chart
Bar Chart
line chart icon
line chart icon
Analyzing data for marketing plan
Businessman wearing virtual reality with digital big data transfer from brain to buzzy software showing futuristic technology generative AI image
abstract background with financial chart with bars and lines, in style of blue, creative financial backdrop
Set of circle percentage diagrams for infographics, 3D design
Data Analysis Dashboard
Asian woman working on customer documents, finance, accounting, taxes in the office.
Vector infographic design template with 4 options or steps
Stock market indicator and financial. Forex trading candlestick chart economic , ECN Digital economy.
Futuristic HUD infographics
Web statistics analytic charts on laptop device screen. Flat vector infographic trend graphs information report concept for planning and accounting, analysis, audit, management, marketing illustration
Multi exposure of chart and financial info and work space with computer background. Concept of international online trading.
Hands, laptop and chart with tablet for business man, analysis or check progress of economy, investment or profit. Financial agent, pc and reading graph for data on fintech app, growth and numbers
Colorful pie chart representation on a smooth gradient background, symbolizing data analysis and information visualization.
A close-up of hands typing on a laptop, displaying vibrant data charts and graphs, set against a modern workspace atmosphere with soft lighting.
Vector infographic template
Behind shot through shoulder of smart man working as insurance statistic while typing on white blank screen laptop according information from graphic chart paper on working desk as background.
Businessman analyzing financial report documents and investment portfolio review. Professional mature fund broker with computer and fact sheet of stock market and investment analysis planning
Bar Chart
Bar Chart
Managers using calculator to analyze sales cost reports and explain summary reports to employees calculate and record summary information data in the office.
Global business growth graph stock financial success market chart on digital investment strategy exchange finance data concept,  technology economy communication network connection with generative ai
Global business growth graph stock financial success market chart on digital investment strategy exchange finance data concept, technology economy communication network connection with generative ai
market research icon vector illustration. Market Analysis icon. Used for SEO or websites
abstract background with financial chart with bars and lines, in style of blue, creative financial backdrop
Transform your data presentation with a two-step dynamic bar chart infographic. This design enhances statistical visualization, making complex information clear and engaging for your audience.
Stock market graph for business analysis on screen monitor. business report for analysis .Finance, Investment and Economic Concepts.
A person is holding a tablet and touching a graph. Concept of analyzing data and making decisions based on the information presented. Scene is focused and serious
Infographics template with icons and element. for business presentations, web site or information banner.
Close-up of male hand making notes, planning new appointments information in organizer personal paper planner at desk.
A businessman presenting a conceptual illustration of big data and data science technology on the internet
Close up of Business using calculator and laptop for doing math finance report on wooden desk, tax, accounting, statistics and analytical research concept
Pensive businessman in city, graphs
Infographic Circle Chart
Business theme graph hologram with minimalistic cabinet interior background. Double exposure. Stock market concept.
Stock market investment trading financial, coin and South Africa flag or Forex for analyze profit finance business trend data background.
The financial stock market graph on a digital screen cinematographic shot close-up. AI Generated
round infographic template. layered, eight step information template. business infographic template
Colorful futuristic digital interface with data visualizations and neon graphics illuminated at night
Businessman analyzing financial report documents and investment portfolio review. Professional mature fund broker with computer and fact sheet of stock market and investment analysis planning
Turkish businessman making training conference meeting with male and female employees explaining statistic information from corporate report, group of experienced people discussing strategy teamwork
Random math number background. Generative AI technology.
Doughnut Graph or Chart Elements as Diagram Design for Business Presentation
The concept of the world of business industry business man in hand showing future world space business Image from space furnished by NASA.


Why Wallsheaven is special?

30 Days on Returns

You can return or replace any product within 30 days without reason.

Free Express Delivery

Delivery is free for all of our products, wherever you are.

Eco Water-Based Inks

Our prints are odorless, ecological, and safe for children with vivid colors from natural dyes.

Simple Installation

Installing WallsHeaven's wallpaper mural is as easy as making paper airplane.

Artist Support

By choosing our photos, you will support the artists from all over the world.