



WallsHeaven makes decorative wall murals in high quality printing

2,759,560 +market+stock Wall Murals - Canvas Prints - Stickers

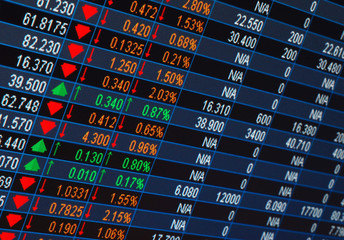
Financial data on a monitor
Coins with arrow up chart increasing growth of profit and inflation stock market global economic trend on white blue background. Business Success and Financial Growth concept.
Financial stock market graph. 3d illustration..
Stock market or forex trading graph in graphic concept suitable for financial investment or Economic trends business idea and all art work design. Abstract finance background. Vector illustration
concept interest rates and dividends ,investment growth percentage and interest on deposits ,increase in interest rates ,Retirement returns ,increase of business profits,finance and investment
Green charts showing growth on an office board
Stock market index graph of stock market financial analysis on LED display concept. Abstract stock market data graph.Stock market financial data statistic graph background.
Yellow up arrow in front of a green screen of stock prices. Illustration of the surge of stock markets
Digital image of various graphs on screen
Successful young male trader talking on the phone, discussing stock market while sitting at desk in the living room at home
Investment Stock market trading chart and stock market fall and loss in red color graph. Global money bankruptcy concept. 3D illustration. Stock market recession and losses. Downtrend line graph
Stock market or forex trading graph in graphic concept for financial investment or economic trends business idea design. Worldwide finance background. Vector illustration.
Stock market investment trading graph growth.Investment finance chart,stock market business and exchange financial growth graph.
All world stock fail background and digital red number on stock board. Concept of financial crisis. Stock market down trend and despair broker man on graph and number with bearis time.
Financial crisis stock chart business on economy market background with down diagram money exchange finance graph or loss global investment trade analysis recession and fall sales price crash risk.
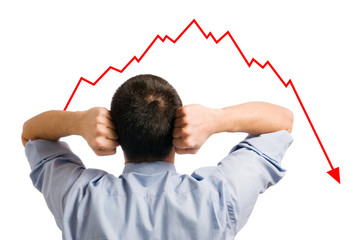
Businessman in terror, graphs concrete
Abstract technology bull on glowing stock market chart. Generative AI.
Stock market exchange
down financial arrows stock market crash
Financial chart with line graph in stock market investment or economic trends business idea.
Asian trader mother studying stock market with child at home - Finance charts, future investment concept - Focus on mobile phone
Stock market investment trading financial, coin and Australia flag or Forex for analyze profit finance business trend data background.
Candle stick graph chart of stock market investment trading
Display of Stock market quotes
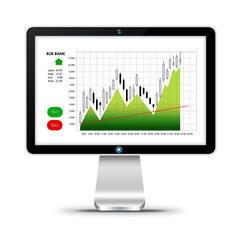
computer with stock market chart isolated over white
Big bull and green stock market. Bull market
A bear waring a suit breaking thru glass signifying stock market crash and a bear market and recession
Digital financial chart indicators, stock market business and exchange financial growth graph.
Earnings Stock Market Reporting Company Profits 3d Illustration
Business candle stick graph chart of stock market investment trading on white background design. Bullish point, Trend of graph. Vector illustration
Silver bar, ingots and coins on financial  report. Growth of silver on stock market concept.
Silver bar, ingots and coins on financial report. Growth of silver on stock market concept.
Business finance chart market exchange of investment financial money stock graph on global economy growth background with world economic trade profit diagram. 3D rendering.
Growing digital graph, financial success
digital financial chart candlestick graph in stock market
Double exposure businessman showing hand sign thumb and stock market chart financial data on electronic board background, The excellence of stock market
Finance trade manager analyzing stock market indicators for best investment strategy
volatile market stock volatility down crash trend price investment index fluctuation
Multi exposure of virtual abstract financial graph interface on British flag and sunset sky background, financial and trading concept
Display of Stock market
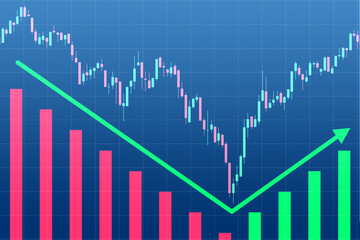
Three different graphs show a rebound. The end of the recession in the economy. Concept - Rebound after the collapse of the economy. Concept - Dead cat bounce. Financial charts on a blue background.
Downtrend chart,red pencil and dice cube with the word SELL. Sel
Graph of financial growth global communications Binary Smart Phones and world Internet Businesspeople press the phone to communicate in the Internet Stock chart Researching process.business Team
Finger pointing at screen showing stock market charts, Commodities and exchange market charts, Business man at work in investment broker agency.
abstract background of blue futuristic technology trading stock market on smart tablet
Stocks fall. Candle stick graph chart of stock market investment trading. Bullish point, down trend of graph. Futuristic red signal trend drop down arrow chart.
Stock market or forex trading graph in graphic concept
Business people, stock market dashboard on screen and coach for trading, finance presentation and graphs. Data analytics, investment information and coaching in team meeting with fintech and crypto
Bullish symbols on stock market vector illustration. vector Forex or commodity charts, on abstract background. The symbol of the the bull. The growing  market.
Bullish symbols on stock market vector illustration. vector Forex or commodity charts, on abstract background. The symbol of the the bull. The growing market.
Sao Paulo, Brazil, November 22, 2022. Display with stock quotes in the modern visitor center of B3, Brasil, Bolsa, Balcao, in the headquarters of BOVESPA, Sao Paulo Stock Exchange, in downtown city
Bullish trading market concept. Business man wearing bull mask. Cryptocurrency exchange
Back view of businessman or trader working with graph and stock market graph on computer at his desk
Business candlestick graph chart of stock market investment trading. Financial chart with up trend line graph.
Blue stock exchange market graph on LED screen for business analysis. Finance and economic graphs.
Stock exchange board background, market index graphs and charts, vector ticker display. Stock exchange screen with financial trade index rates, finance fund stocks price increase and decrease charts
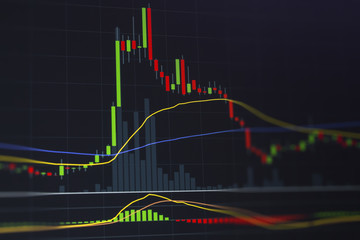
stock market investment graph with indicator and volume data.
Financial chart with trading graph in stock market and world map on blue color background
Double exposure of abstract creative financial chart hologram on German flag and blue sky background, research and strategy concept
Financial graphs and digital indicators overlap with modernistic urban area, skyscrabber for stock market business concept. Double exposure.
green stock market chart with bull running in it , glowing lines, dark background
Dices cubes with the words SELL BUY, pencil and financial chart.
Mobile phone with stock market
stock market concept
Global financial investment, Stock market up arrow, and candlestick on blue background. Financial data Information for Trading and business investment. 3d rendering
abstract background of buy or sell stock market and indicator candle graph
Vector illustration. Flat background. Market trade. Trading platform ,account. Moneymaking,business. Analysis. Investing
Stock market graph
Stock market graph
Creative vector illustration of global finance crisis background. Art design economic crisis, fall down stock market template. Abstract concept business graph arrow, finance bankrupt declining element
Stock price chart. Forex trading
Green stock market  graph,green bar and the line graph feeling confidence,  growth, motivation, hope, and bull stock market after war crisis and pandemic. Background for the economy and data analysis.
Green stock market graph,green bar and the line graph feeling confidence, growth, motivation, hope, and bull stock market after war crisis and pandemic. Background for the economy and data analysis.
Young businessman looking at his declining share
Double exposure of business woman holding blank tablet for Stock market quotes and chart in monitor computer room with business office equipments .business and money trading concept,panorama photo
Green uptrend abstract background. A group of the green bar and the line graph feeling that rise, growth, motivation, hope, and bull stock market. Background for the economy and data analysis.
Abstract stock market digital interface, blue color scheme
Candle chart for capital gain in financial business concept.  Happy investor and winner for large profits playing the market.
Candle chart for capital gain in financial business concept. Happy investor and winner for large profits playing the market.
Concept of business collapse . Mixed media
Abstract financial chart with trend line graph and bar chart in stock market on white color background
Stock market collapse after brexit. A businessman thinking, look falling chart. Collapse stock markets, declining market graph. Financial crisis background
Financial trade concept. Stock market and exchange. Candle stick graph chart.
stock market quotes
stock market quotes
breakout up-trend market structure
3D rendered up trend stock candle stick on white fog background
A stock trader's world: Multiple screens display real-time economic news, market trends, and currency rates, emphasizing the critical analysis and concentration required in trading.
A businessman is looking at a graph on a monitor. An exchange broker evaluates stock market trends. A man with glasses in front of a curve of the dynamics of the economy.
downtrend line graph in stock market on red and  a virus abstract background
downtrend line graph in stock market on red and a virus abstract background
Display of Stock market quotes
Economical stock market chart
Stock market exchange line graph price with investment of business financial digital background - charts stock or forex trading indicator on computer monitor for investors
Female stockbroker in formal clothes works in the office with financial market
Digital Candlestick Stock Chart 3D View
Close up of man hand pointing at growing upward chart, map, arrows and forex graph on blurry background. Global trends, trading and finance concept. Double exposure.


Why Wallsheaven is special?

30 Days on Returns

You can return or replace any product within 30 days without reason.

Free Express Delivery

Delivery is free for all of our products, wherever you are.

Eco Water-Based Inks

Our prints are odorless, ecological, and safe for children with vivid colors from natural dyes.

Simple Installation

Installing WallsHeaven's wallpaper mural is as easy as making paper airplane.

Artist Support

By choosing our photos, you will support the artists from all over the world.