WallsHeaven makes decorative wall murals in high quality printing

885,024 +analysis+exchange Wall Murals - Canvas Prints - Stickers

abstract background of trading stock market MACD indicator technical analysis graph, Moving Average Convergence Divergence on blank smart mobile phone
Modern data analysis center with multiple screens displaying graphs.
Stock and bond market graph with trading desk bank office interior on background. Multi exposure. Concept of financial analysis
Forex market background, trading on the currency market Forex. Currency exchange rate for world currency: US Dollar, Euro, Frank, Yen. Financial, money, global finance, stock market background.
Market economy graph statistic showing growth of profit analyzing financial exchange on increase digital money background
Abstract holographic stock exchange price chart for financial analysis and data visualization
Exchange analytics. Created with generative Ai technology
Businesswoman climbing career ladder as trader broker
Happy financial analytics looking at screen with chart and smile
Business women working exchange at modern office.technical price graph and indicator, red and green candlestick chart and stock trading and bitcoin computer screen background.
Detail graphics stock exchange
Businessmen work with stock market investments using laptops to analyze trading data. desktop computer with stock exchange graph on screen. Financial stock market. Analyzing data in office background.
Business people meeting at office with use post it notes on clear board to share idea working.
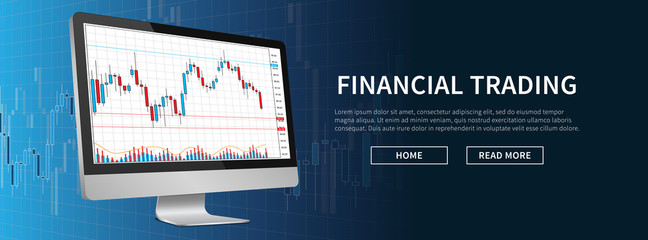
Financial stock trade webpage banner with desktop vector illustration. Computer with financial market signals to buy and sell concept. Landing page banner template for stock exchange market graphic de
Stock exchange market graph. Finance, exconomic, business concept.
Pictogram of question mark. FAQ icon. Information exchange theme icon. Vector, flat, eps 10
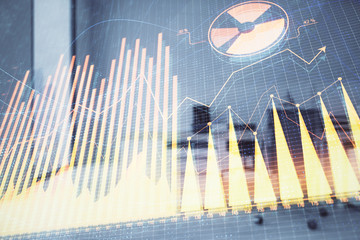
Forex graph on city view with skyscrapers background double exposure. Financial analysis concept.
Graphical stock market or forex trading graphs are useful for business ideas involving financial investments or economic trends. background in abstract finance. generative AI
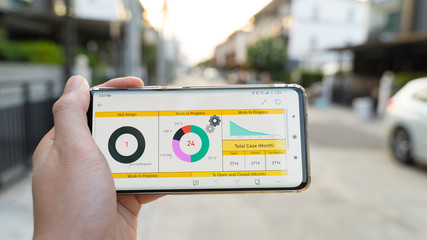
Business man analysis graph visualization on mobile for anywhere anytime
African businessman in office, financial graph
Business visual data analyzing technology by creative computer software . Concept of digital data for marketing analysis and investment decision making .
Multi exposure of virtual creative financial chart hologram on San Francisco skyscrapers background, research and analytics concept
South Africa flag and chart falling US dollar position with a fan of dollar bills
Fundamental and technical analysis for professional technical trading as concept. Digital graph of financial instruments with some indicators including of MACD. EMA and the volume analysis.
Graphical representation of volumes and time intervals of digital cryptocurrency up indicating crypto rising in value.
Multi exposure of stock market graph on conference room background. Concept of financial analysis
Stock exchange trading analysis investment financial on display crisis stock crash down and grow up gain and profits financial impact or forex graph Stock market digital graph chart business indicator
Business strategy and planning of target. Economic analysis of Digital marketing.Businessman analyzing and calculating financial data for long term investment growth goals and company finance balance.
Hand of a businessman or trader holds a magnifier glass, examining the stock market chart for analysis. Business investment concept for financial decision-making and strategic planning.
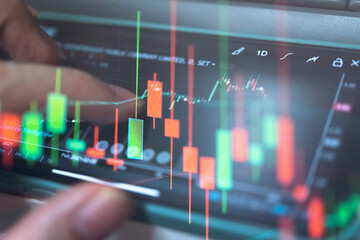
Stock market graph analysis for finance investment. Stock exchange market chart background.  Candle stick graph chart with indicator. Graphs trading including of up and down trend.
Stock market graph analysis for finance investment. Stock exchange market chart background. Candle stick graph chart with indicator. Graphs trading including of up and down trend.
Detail graphics stock exchange
Person examines value
management icons set
Double exposure Financial graphs and diagrams. Business, economics and investment concept.
Stock exchange market chart, Stock market data on LED display. Business analysis concept.
Man analysis forex concurrency stock graph market for trading forex to profit by order sell or buy in night at home
Double exposure of man's hands holding and using a phone and financial chart drawing. Market analysis concept.
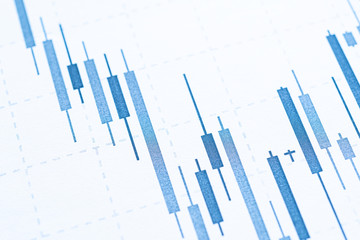
Business candle stick graph chart of stock market investment trading. Trend of graph. Vector illustration
Global business and stats concept
Businessman using digital tablet analyzing sales data with financial trading graph and economic growth report on virtual screen
Stock exchange market concept, hand trader holding on digital tablet with graphs analysis candle line.
Business startup concept.Young man working together with partner in modern office loft
Candlestick chart in financial stock market on digital number background. Forex trading graphic design and Stock market trading trend as concept.
Forex candlestick pattern. Trading chart concept. Financial market chart. Energy and Power icons set and grunge brush stroke. Energy generation and heavy industry. 3D rendering
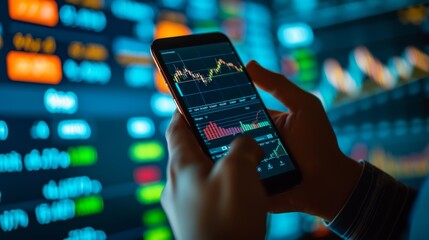
Crypto trader investor broker hand holding phone app executing financial stock trade market trading
Close up Portrait of a woman inside a bustling trade exchange floor analyzing market fluctuations
Financial business graph chart analysis stock market graph background / Stock market or forex trading graph and candlestick chart indicator for financial investment
Stock market chart digital tablet
Trading concept with financial chart
Detail graphics stock exchange
Stock exchange market chart, Stock market data on LED display. Business analysis concept.
cityscape with modern skyscrapers and overlaid financial graphs, symbolizing the bustling economy and the stock market.
Busy business man trader, broker analyst investor using pc computer analyzing stock exchange trade crypto market digital data investing finances in stockmarket working in office. Copy space.
Stock exchange market graph. Finance, exconomic, business concept.
Global Business Intelligence, A businessman uses a digital interface to analyze data, unlocking insights for strategic decision-making. world map composition signifies international reach of business.
Multi exposure of woman hands typing on computer and financial graph hologram drawing. Stock market analysis concept.
Candle stick graph chart of online stock market trading with mobile phone ,3d render illustration background
Rising quotes in stock market concept with businessman looking at digital wall screen with global forex chart indicators.
Bill of Exchange – Statistics/Business. Laptop in the office with term on the Screen. Finance/Economy.
Candle stick graph chart with indicator showing bullish point or bearish point, up trend or down trend of price of stock market or stock exchange trading, investment concept.
Stock exchange market graph analysis background.
Financial stock market graph on technology abstract background, Creative forex chart wallpaper, financial graph on technology abstract background represent financial Growth or crisis
Data analyzing in exchange cryptocurrency market: the candles charts , bars and other trade analysis indicators on display. Analytics price change cryptocurrency BTC to USD - Bitcoin / US Dollar.
A background filled with complex charts and infographics representing financial trends and market movements.
Business, graph and info graphics on paper for data analysis, seo tools or statistics background. Colourful, illustration and bar graphic for marketing strategy, stock market and trading wallpaper
Collection businese line icon set. Icon flat style for stock vector. Sign finance for logo, infographic, management, presentation, illustration. 2
Economic crisis in the price of a bag of coffee. Financial collapse, drop in stock value. Graph falling. Economic crisis. Agricultural production decline
.Business woman using mobile smartphone on global network connection and data customer connection on blue background, Digital marketing, Data exchanges,  Innovative and technology.
.Business woman using mobile smartphone on global network connection and data customer connection on blue background, Digital marketing, Data exchanges, Innovative and technology.
Business team with virtual screen and data statistic index graph, analysis graph of stock market financial, stock exchange and stock market data concept.
Detail graphics stock exchange
Stock exchange market concept, Business investor trading or stock brokers having a planning and analyzing with display screen and pointing on the data presented and deal on a stock exchange
Contemporary business
Stock exchange market graph on LED screen for business concept.
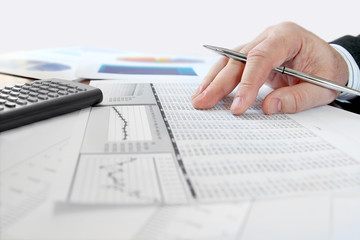
Male hand with pen analyzing  financial data
Male hand with pen analyzing financial data
Multi exposure of woman hands typing on computer and financial chart hologram drawing. Stock market analysis concept.
Stock exchange graph chart analysis global financial statistic data
World trading concept with financial graphs, glowing candlestick and diagram on digital screen
Analyzing Coronavirus covid-19 with financial data and stock graph. Analysis of numerical data and stock market communication with businesses worldwide. Stop Novel Coronavirus outbreak covid-19.
A businessman analyzing stock market graphs on a digital tablet
Data analysis concept with engineer or analyse holding wireless keyboard to arrangement information analytic to summarise and decision to research and development new products investment
Business and financial concepts and reports, abstract technology communication concept
Financial stock market graph. Stock Exchange. Selective focus.
Stock exchange market graph on screen monitor. Economic and financial concept.
Top view. Tired business woman with headache at office with glass of water and pill on the background of graphics and charts printed on the paper.
Making it better. Colleagues traders sitting by desks in front of computer monitors and discussing strategies while working in the office. Blackboard full of charts and data analyses in background
Stock market graph analysis for finance investment. Stock exchange market chart background.  Candle stick graph chart with indicator. Graphs trading including of up and down trend.
Stock market graph analysis for finance investment. Stock exchange market chart background. Candle stick graph chart with indicator. Graphs trading including of up and down trend.
Stock market chart with trading desk bank office interior on background. Double exposure. Concept of financial analysis
Portrait of a young female financial analyst
Global business analysis and asset investiment, colorful, black background, banner, generative ai
Laptop with mobile phone, notebook and charts on dark background. Trading concept
Business investment data analysis smartphone
economic crisis in mexico, mexican flag on economic graphs.
Stock market graph analysis for finance investment. Stock exchange market chart background.
Stock exchange market concept, hand trader touching on smartphone with graphs analysis candle line on bokeh colors light in night atmospheric city.
Double exposure of forex chart drawing over people taking notes background. Concept of financial analysis
An investor is presenting  support line of stock chart
An investor is presenting support line of stock chart


Why Wallsheaven is special?

30 Days on Returns

You can return or replace any product within 30 days without reason.

Free Express Delivery

Delivery is free for all of our products, wherever you are.

Eco Water-Based Inks

Our prints are odorless, ecological, and safe for children with vivid colors from natural dyes.

Simple Installation

Installing WallsHeaven's wallpaper mural is as easy as making paper airplane.

Artist Support

By choosing our photos, you will support the artists from all over the world.