

WallsHeaven makes decorative wall murals in high quality printing

67,957 %2Banalysis%2Bexchange Wall Murals - Canvas Prints - Stickers

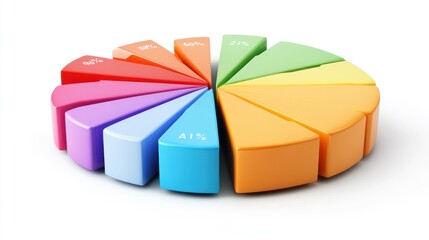
D Colorful Pie Chart Business Data Analysis Concept
Concept Shot with Visualisation of Running Computer Code on Foreground. Portrait of Handsome Indian Man in Working on Computer at Night in Office. Digital Entrepreneur Creating Modern Software.
Scientist in protective gear analyzing DNA strand. Genetic research and biotechnology concept illustrated in blue tones.
Business Cycle Diagram Infographic With 4 Steps and Editable Text for Business Presentation, Cycles, Progress, and Plans.
Colorful 3D bar graph chart illustration against a gradient background, depicting data analysis and business growth trends.
Close-up Of A Humanoid Robot's Hand Analyzing Invoice On Laptop At Workplace
Laptop displaying a growing chart indicating a positive trend, symbolizing financial success and business growth
High angle shot of a young Hispanic industrial engineer wearing safety goggles and manipulating a 3D model of a circuit motherboard on a computer screen in a high-tech research
One adult man sit at office and look, read document on laptop at office
blood analysis outline icon. Linear vector from medical concept. 6 different line style blood analysis icon included thin, light, regular, medium, bold, black
collection of infographic elements, pie chart vector, bar graph, color wheel
Woman holding the pH test and showing a strip with the color orange that is related to pH 4.0
3D illustration of a business team discussing a project, collaborating and analyzing data on a document in a corporate setting.
Close-up of a medical professional hands adjusting an IV drip in a hospital room
ビジネスマンの経済・金融・資産・成績のグラフ
digital transformation of the healthcare sector, 16:9
A scientist analyzes data on a computer screen, featuring a 3D brain model and other digital interfaces.
E-commerce data software provide modish dashboard for sale analysis to the online retail business
Global Trends in Oil Price vs Renewable Energy Growth: 3D Illustration with Copy Space and Selective Focus in Ultra HD
Pie chart infographic icon set. Circle diagram collection for infographic, data analysis, web design on white background
Magnifying glass focusing on Know Your Customer (KYC) compliance and security interface on digital screen. Identity verification, E KYC
intersection of three sets venn diagram vector illustration isolated on white background
 Digital Growth Chart 4
Digital Growth Chart 4
E commerce Investment Planning and Business Strategy Visualization
Market trends analysis flat design side view business insights theme animation Vivid
A modern office setting with a businesswoman analyzing Key Performance Indicator data on her laptop
Colorful Pie Chart with Percentages
On-Premise vs. Cloud Data Warehousing: Create a visual representation comparing on-premise and cloud data warehousing solutions, emphasizing the pros and cons of each app
Customer service 24 hours 7 days a week theme with businessman using a tablet computer at night
Round Venn diagram template with vibrant, overlapping shapes for data blending and information analysis. Great for modern presentations.
Accessible E commerce Platform Dashboard with Data Analytics and Voiceover Support
Cartoon Scientist Character Looking Through Microscope with Test Tubes and Chemicals
Digital representation of a human heart with ECG waveform, combining medical technology and futuristic data analysis in a vibrant design.
Scientist in Protective Gear Holding Sample Tube in Lab
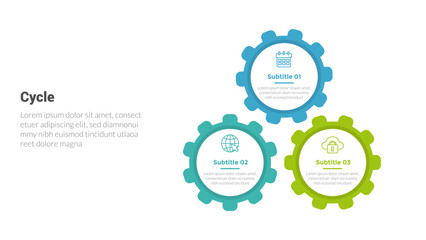
cycle or cycles stage infographics template diagram with gear machine system and 3 point step creative design for slide presentation
digitalization healthcare sector, 16:9
Touch of the Future web 3.0
Business people working at table in modern office room while analyzing financial data report .
Energy Evolution: Green Energy vs Oil Price Comparative Graphs in 3D Illustration with Copy Space, Selective Focus, and Ultra HD Detail
2 points template infographic outline style with 2 point stage or step comparison template with arrow line container opposite direction for slide presentation
D Colorful Bar Chart with Human Figures  Business Data Analysis   Financial Growth and Strategy
D Colorful Bar Chart with Human Figures Business Data Analysis Financial Growth and Strategy
Modern Conference Room: A sleek and minimalist conference room with a large screen displaying data and charts, setting the scene for strategic business meetings and presentations. This image conveys p
Profit vs. revenue: Explain the difference between profit and revenue. How does understanding this distinction help businesses
data analytics cylinder outline icon. Linear vector from user interface concept. 6 different line style data analytics cylinder icon included thin, light, regular, medium, bold, black
R&D Strategy icon
R&D Strategy icon
Return on investments are equal. ROI, Return on investment concept. Marketing cost, funds parking, profit and loss or financial goals. 3D investment vs return on balance scale
Atrial depolarization forms a P wave, ventricular depolarization forms a QRS wave, and ventricular repolarization forms a T wave, which constitutes a common waveform of the electrocardiogram.
Handsome Young Man Working on Desktop Computer. Digital Entrepreneur Typing Code, Developing Modern Software, Designing E-Commerce Apps, Developing e-Business. Overhead View.
Colorful infographic pie chart with overlapping circular shapes.Flower form graphic circle divided in 9 segments.Vector,illustration.
Generative ai collage picture image of professional it specialist programming online computer system
Business Infographic modern design template for banners and infographics for 3 triangle step
Vector brain infographic design template with 4 steps human head diagram design study presentation
Close-up of a molecular model being adjusted, symbolizing cutting-edge R&D in advanced labs.
Business infographic. Vector Infographic Cycle design template with icons and 4 options or steps.
Adult young caucasian woman stand and read a book in the living room
Blood sample tube for Immunoglobulin G or IgG subclass test
Touch of the Future web 3.0
Eight option cycle infographic chart. Vector illustration
A fingerprint analysis station with a digital scanner --ar 16:9 Job ID: 5142714b-87a3-4301-b0e8-bf99465776f2
A hand is holding a block of wood with the letters V, A, L, U, and E on it
Intense competition: boy vs. robot chess match
Modern set of 3 cute 3D cameras in pastel tones, displayed against a white background
Business people working at table in modern office room while analyzing financial data report .
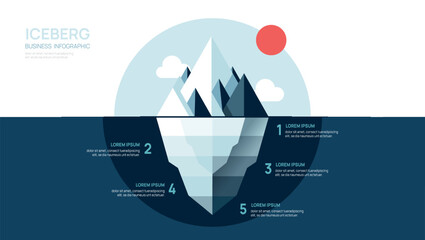
Iceberg infographic template for business. Modern 4 steps to success template vector infographics.
Futuristic laboratory with advanced DNA analysis technology, showcasing modern science equipment and digital displays, blue neon lights.
Abstract depiction of blockchain technology and its impact on finance
Interactive KYC compliance interface with the user. Business professional interacting with a Know Your Customer (KYC) compliance and security interface on digital screen. Identity verification, E KYC
Magnifying Glass focuses on online education concepts on a blue background, E-learning education, internet lessons, and online webinar design
The image features three white cubes displaying the letters
The image features three white cubes displaying the letters "E," "S," and "G," set against a green grass-like background, symbolizing Environmental, Social, and Governance criteria.
Research and development, businessman holding light bulb with R and D icons on virtual screen for research and development, technology, science, business
Smart industry 4.0 and automation concept. Man interacts with digital interface Industry 4.0 icons, symbolizing smart manufacturing, AI, IoT, automation, and global connectivity in industrial systems.
Generate a realistic vector illustration of a decision tree diagram with 9 empty squares.
Shopping with futuristic tech interface
Adult caucasian man sit at home and look on laptop and hold paper
Mobile mockup interface advertising smartphone mock up template 3d banner or poster design vector file
Touch of the Future web 3.0
Generative ai collage image photo of professional it specialist analyzing data warehouse room
swot analysis concept infographic template banner with pyramid shape and outline circle stack with 4 point list information
Three-Dimensional Clay Pie Chart for Marketing Analysis, Featuring Vibrant Segments, Engaging Visual Representation, Ideal for Presentations and Educational Purposes, Isolated Background
set of marketing analysis line icons
Investor analyzing potential returns on real estate investments with charts and graphs --ar 16:9 --personalize 4oz316o --v 6.1 Job ID: fa22de70-f8ec-4ede-a4ae-dc8b58118579
Digital communication and virtual screen metaverse technology globe internet concept WEB 3.0. man using a laptop.
Scientist hold blood samples for hepatitis virus test (Hepatitis A, B, C and E)
SWOT analysis infographic, Corporate strategic planning diagram graphic elements. Company advantages and disadvantages presentation slide template.
Financial analyst analysis business financial report.
Interactive KYC compliance interface with the user. Business professional interacting with a Know Your Customer (KYC) compliance and security interface on digital screen. Identity verification, E KYC
A person is holding a red tube of vitamin D. The tube is labeled with the word vitamin
D Pie Chart with Colorful People Figures Representing Demographics and Data Analysis
Minimum Viable Products (MVP) and Build-Measure-Learn loops infographic template has 3 steps to analyse such as biuld (product), measure (data) and learn (ideas). Creative business visual slide metaph
Abstract technology landscape featuring vibrant red and green digital binary code, symbolizing big data concepts and futuristic innovation in a closeup view.
pyramid icon. vector dual tone icon for your website, mobile, presentation, and logo design.
Business series set, color 1 - modern flat vector concept illustrated topics - Company, teamwork, collaboration, chat, error 404. Creative landing web page design template
Circle chart infographic template with 6 options for presentations and a full editable vector.
A forensic scientist analyzing evidence, profession background, job background, work picture, banner, template, web design, aspect-ratio 16:9
business woman or accountant who are using a calculator to calculate business data Accounting documents and laptop computer at the office business idea
Touch of the Future web 3.0
a Brazilian businesswoman analyzing financial data on multiple screens in a high-rise office
Business people working at table in modern office room while analyzing financial data report . Jivy
Head engineer following the factory process using Industry 4.0. Facility operator control production uses computer screens with SCADA system


Why Wallsheaven is special?

30 Days on Returns

You can return or replace any product within 30 days without reason.

Free Express Delivery

Delivery is free for all of our products, wherever you are.

Eco Water-Based Inks

Our prints are odorless, ecological, and safe for children with vivid colors from natural dyes.

Simple Installation

Installing WallsHeaven's wallpaper mural is as easy as making paper airplane.

Artist Support

By choosing our photos, you will support the artists from all over the world.